Checked eROdays
eROday |
Date - Time (UTC) |
TSTART |
TSTOP |
ZZZ |
WWW |
|
|
43068 |
2019-08-26 T16:59:55 |
6.201648e8 |
6.201792e8 |
|
|
|
43069 |
2019-08-26 T20:59:55 |
6.201782e8 |
6.201936e8 |
|
|
|
43070 |
2019-08-27 T00:59:55 |
6.201936e8 |
6.202080e8 |
|
|
|
43071 |
2019-08-27 T04:59:55 |
6.202080e8 |
6.202224e8 |
|
|
|
43072 |
2019-08-27 T08:59:55 |
6.202224e8 |
6.202368e8 |
|
|
|
43073 |
2019-08-27 T12:59:55 |
6.202368e8 |
6.202512e8 |
|
|
|
43074 |
2019-08-27 T16:59:55 |
6.202512e8 |
6.202583e8 |
|
|
|
43098 |
2019-08-31 T16:59:55 |
6.206077e8 |
6.206112e8 |
|
|
|
43099 |
2019-08-31 T20:59:55 |
6.206112e8 |
6.206256e8 |
|
|
|
43100 |
2019-09-01 T00:59:55 |
6.206256e8 |
6.206400e8 |
|
|
|
43101 |
2019-09-01 T04:59:55 |
6.206400e8 |
6.206544e8 |
|
|
|
43102 |
2019-09-01 T08:59:55 |
6.206544e8 |
6.206688e8 |
|
|
|
43103 |
2019-09-01 T12:59:55 |
6.206688e8 |
6.206832e8 |
|
|
|
43104 |
2019-09-01 T16:59:55 |
6.206832e8 |
6.206904e8 |
|
|
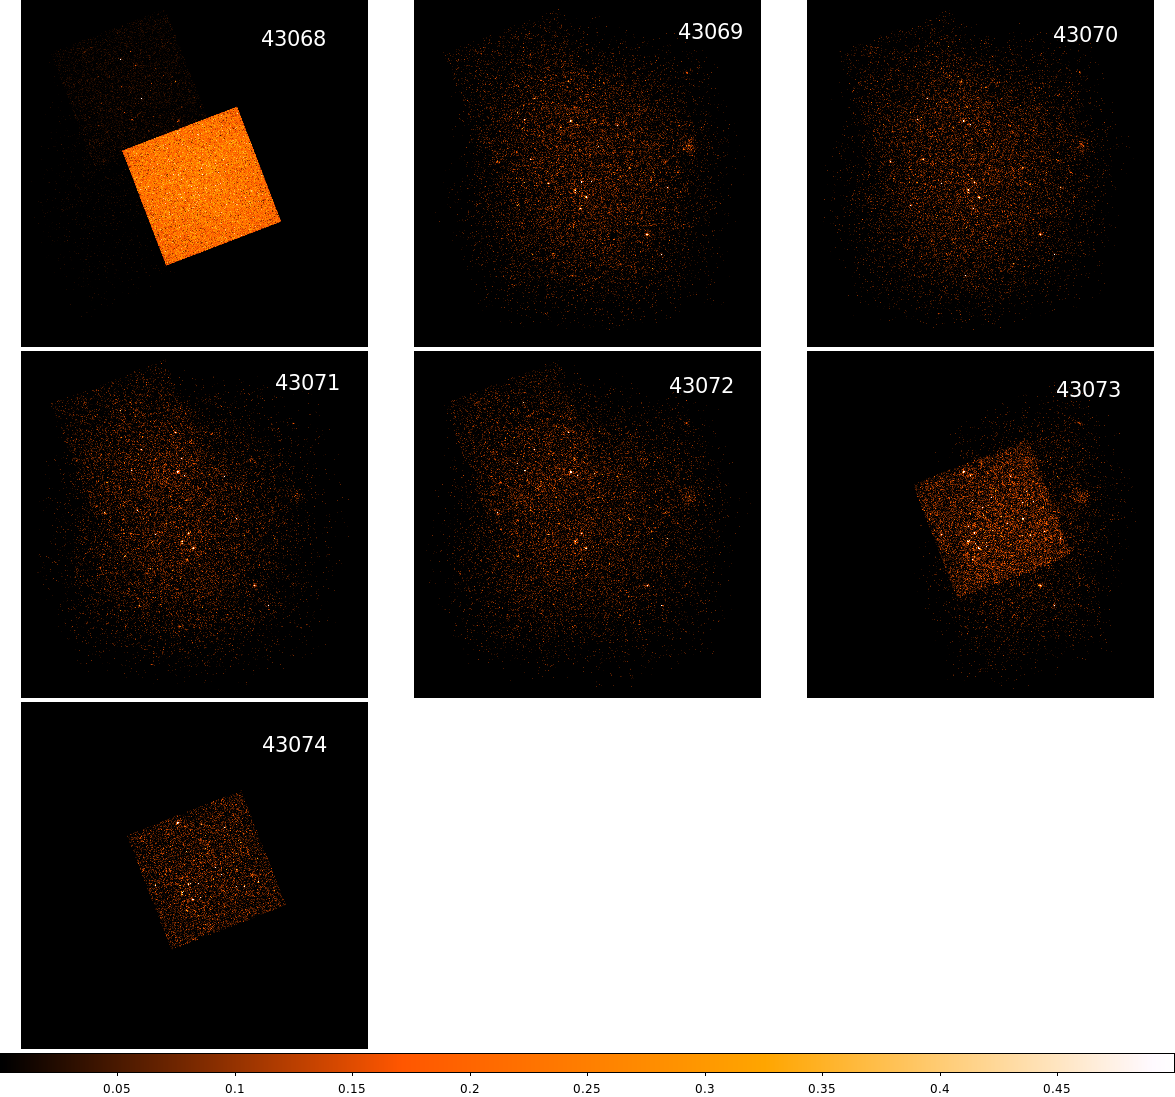
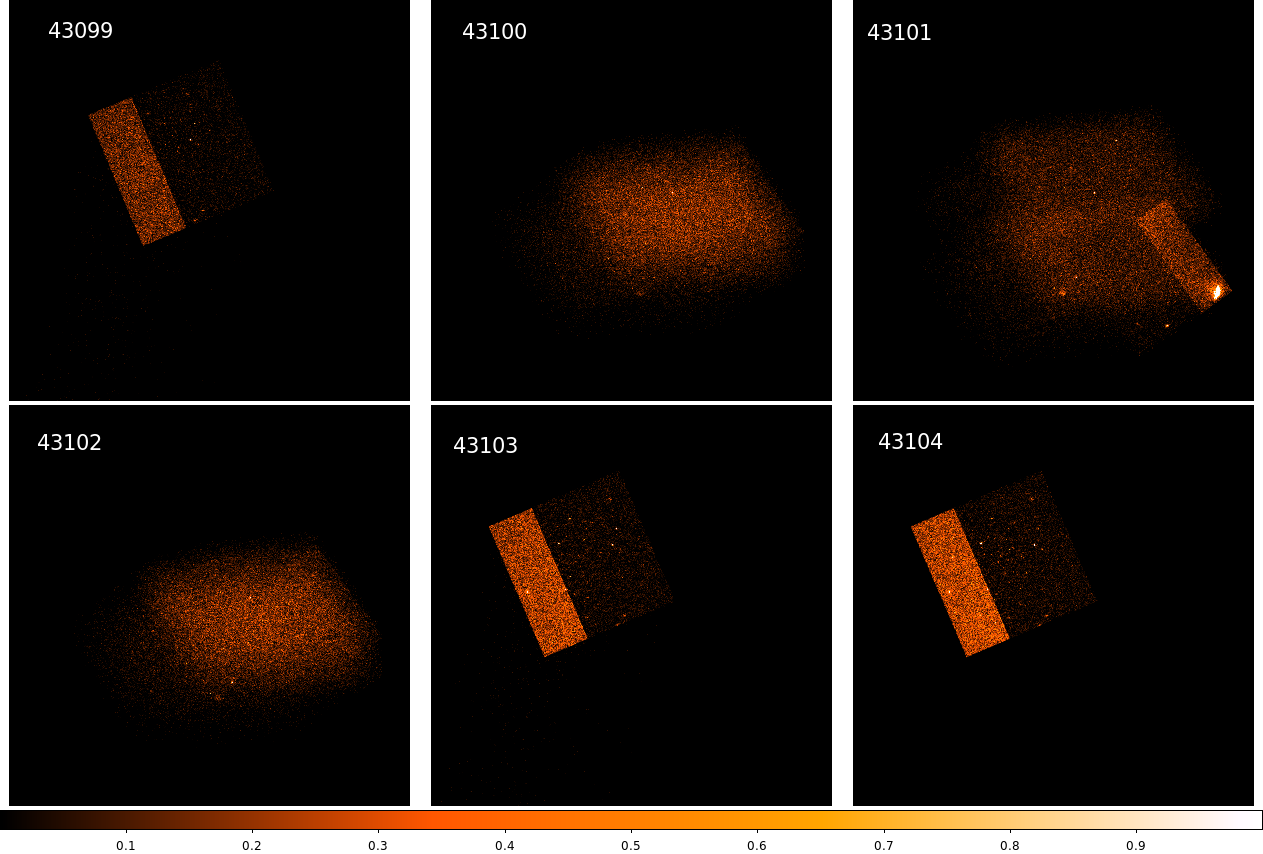
Photon image of the eROdays
Images in the 0.2-10 keV energy band.
Removed / Corrupted data
The items are sorted in order of their frequency (most at top)
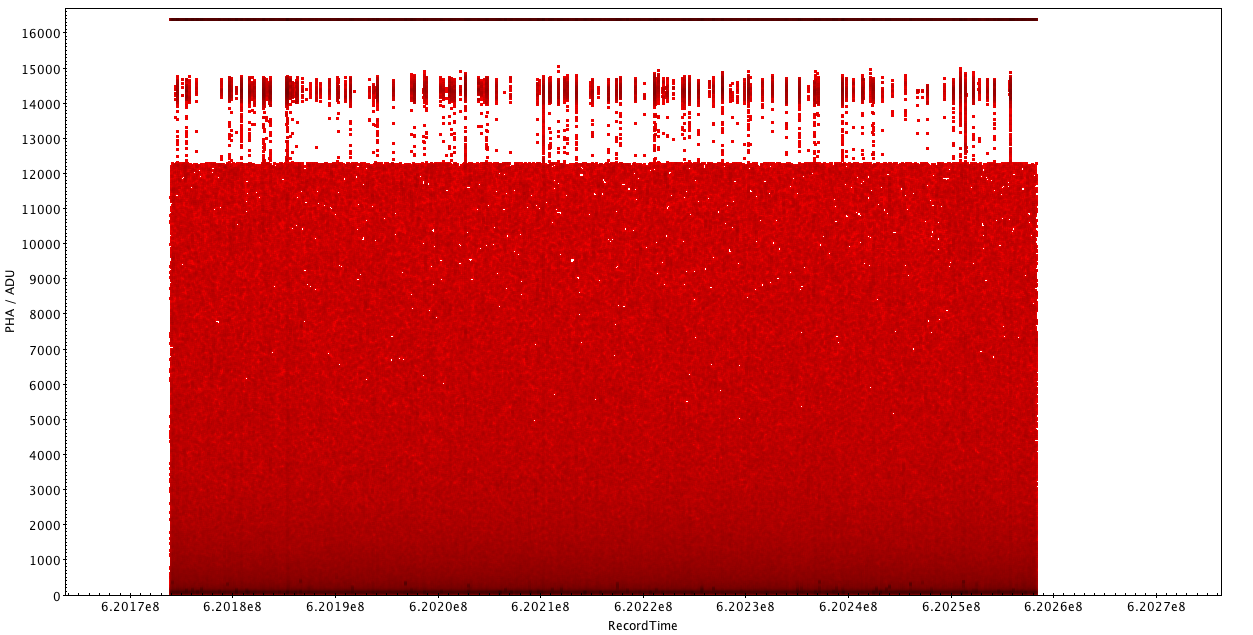
- We find duplicate Events, defined as having the same RECORDTIME / RAWX / RAWY. These events usually differ only by their PHA value. The number of duplicates can reach numbers in the order of about 25! Typically at least one of these events show a PHA value of more than 16000. (duplicated events)
- We typically observe a random distribution of events in the preprocessed eventfile which contain settings, for which the DATASRC and/or TIMESRC are not set to 0, which is the expected setting. In addition most of these events show a subsecond counter of above 120, the maximum we expect is 95. A light curve of subseconds is provided down below. (weird events)
- Moreover we find that some data contain information about the env and/or env2 encoding which should also not be the case. These events occur typically twice one where the env/env2 mode is enabled and one it is disabled. (env-mode events)
- In rare cases we find that the PHA value is undefined but the PHA1/PHA2 value is set
1st set of eROdays
Duplicated events: ~5%
Weird data *): ~3.5%
env-mode: ~0.7%
2nd set of eROdays
Duplicated events: ~11%
Weird data *): ~7-8%
env-mode: ~1.3%
comments:
- during this time the threshold for 1/3 of the detector was changed
- a second camera was turned on during this time
Both of these issues could be a reason on why the percentages of corrupted events doubled.
A quick look at the number of corrupted events in a file containing the timespan when the threshold change occurred indicates, that this caused the increased number of corrupted events. Since there were less corrupted data than the average in the 2nd part.
*) time source or data source not equal 0
Record time light curves
Comment / Description
Lightcurves (recordtime) before and after filtering. RecordTime (high resolution creation of the record, calculated from EXT_OTS, INT_OTS, SCTime, SubSec) for more details ask Ingo or see https://erosita.mpe.mpg.de/eROdoc/raw/rawFitsFileFormats_2018-08.html
Open Questions / Items
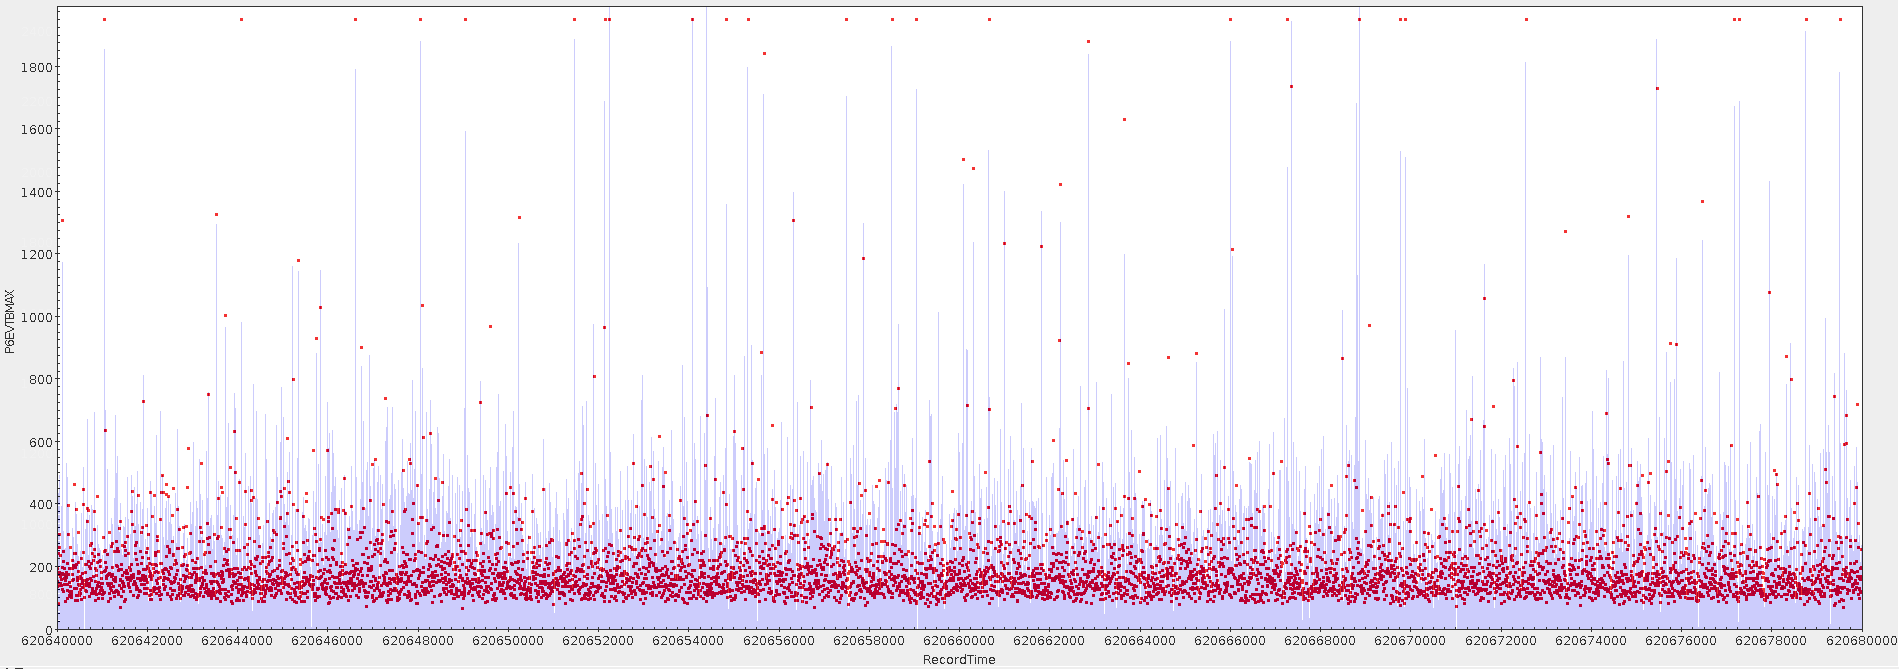
We find spikes in the lightcurves which are not removed event after the initial filter stage. These spikes are typically only in one frame. And show interesting patterns when investigated in camera coordinates.
Red: unfiltered; Green: filtered. Both histograms are a zoom!
1st set of eROdays
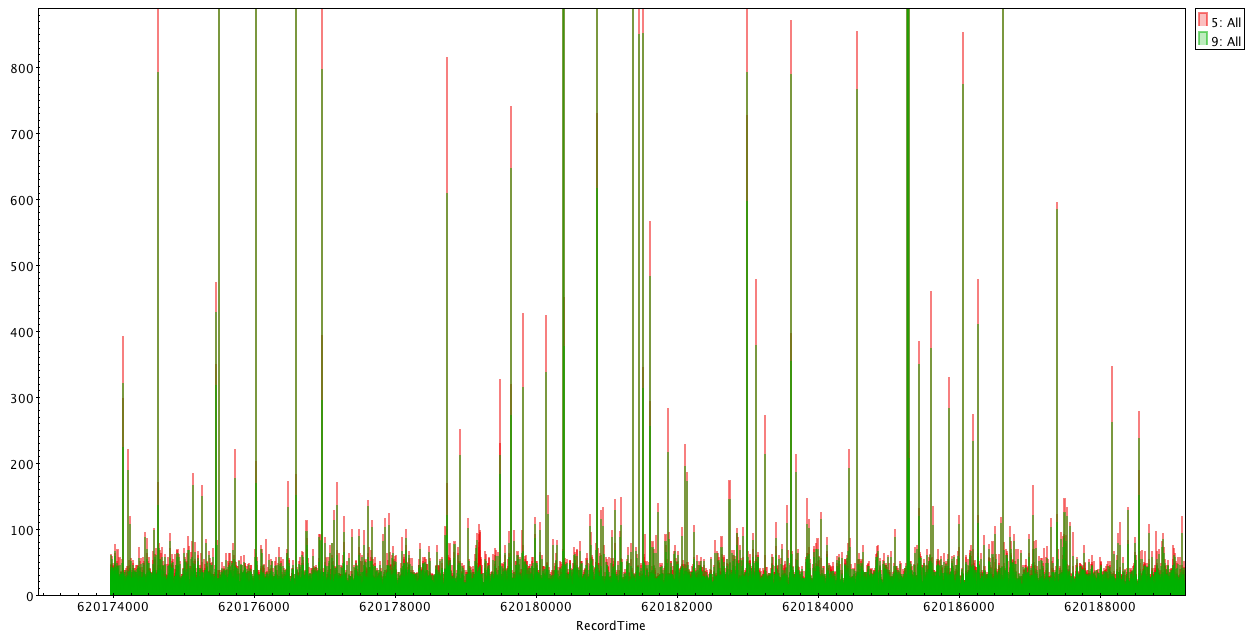
Filtering of events does not remove spikes. These are addressed by the pattern task.
2nd set of eROdays
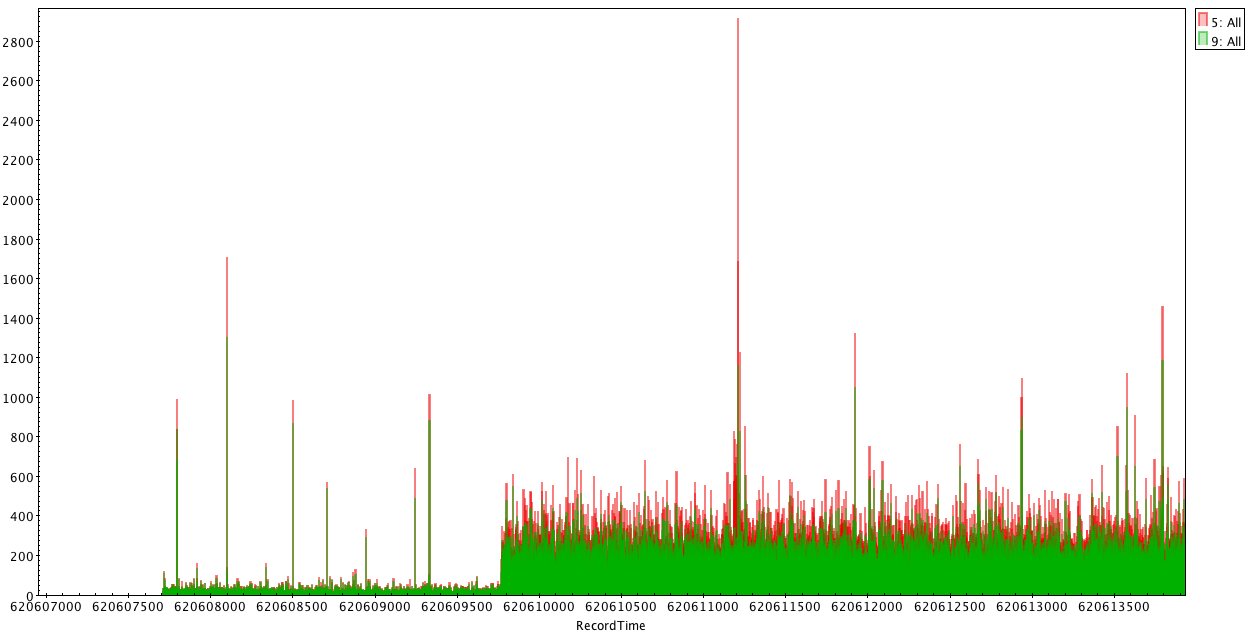
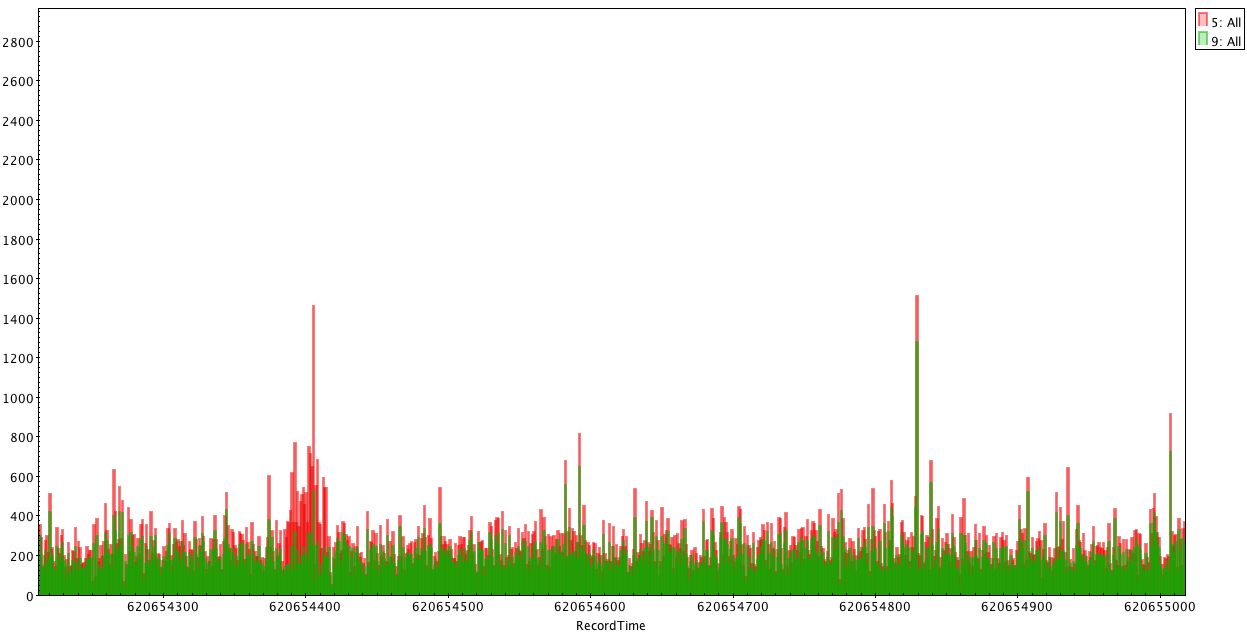
Filtering of events does not remove spikes in the first light curve. But the second light curve shows a bump (620654400) in the light curve which is filtered out. This bump thus seems to be caused by more corrupted events than usual and was longer than one frame. This would need more investigation on what caused more corrupted events than usual.
two examples of RAWX / RAWY distributions of "spikes" in lightcurve
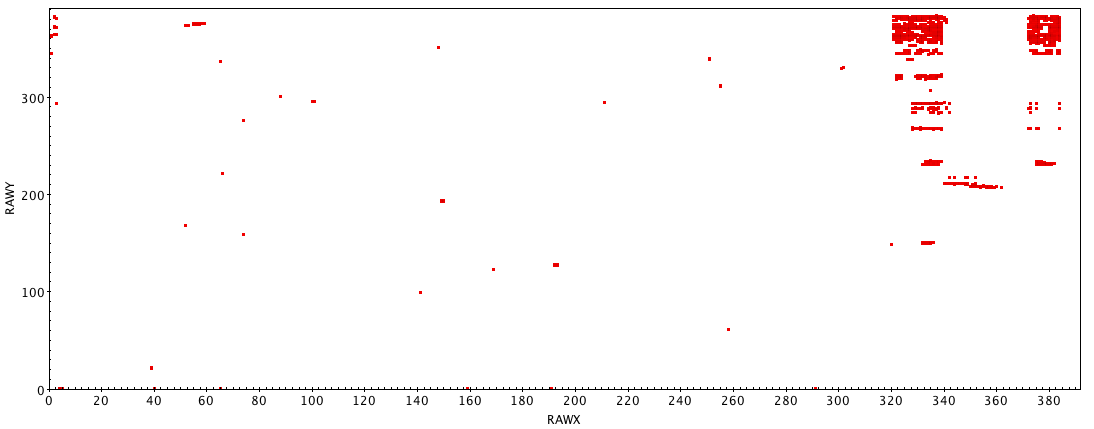
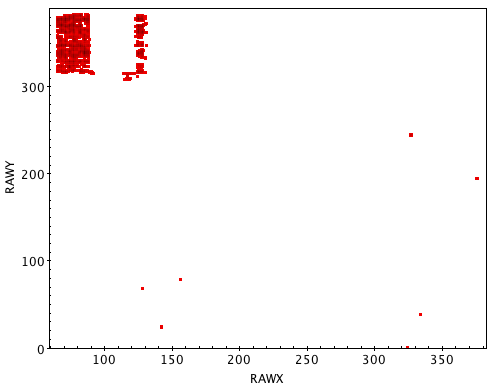
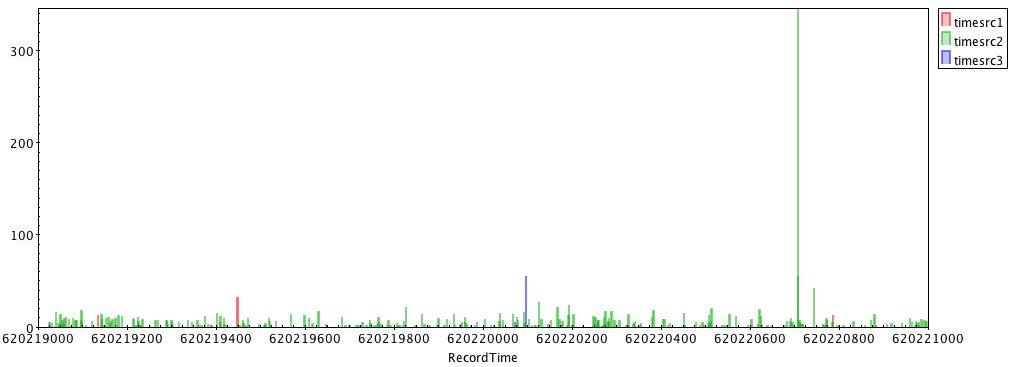
example lightcurves for non timesrc 0 events
We see that timesrc 2 events are constantly created but they also show single frame spikes. These do not necessarily coincide with spikes of the lightcurve of timesrc 0 events. timesrc 1 and timesrc 3 events only appear sporadically and only last for 1 frame.
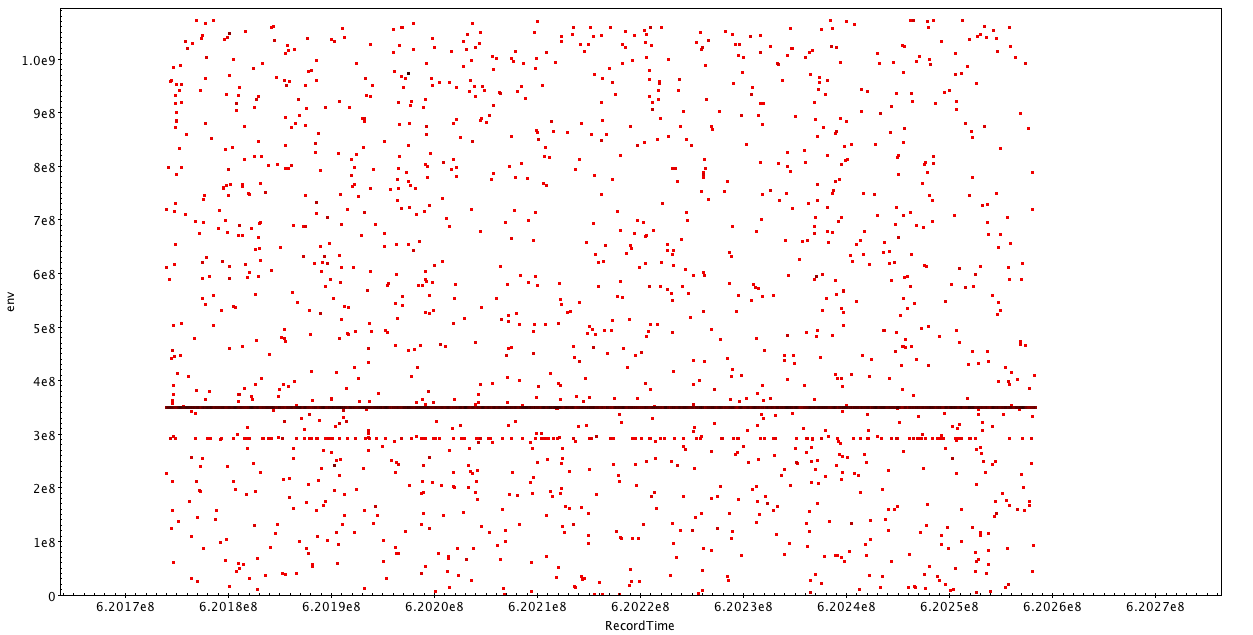
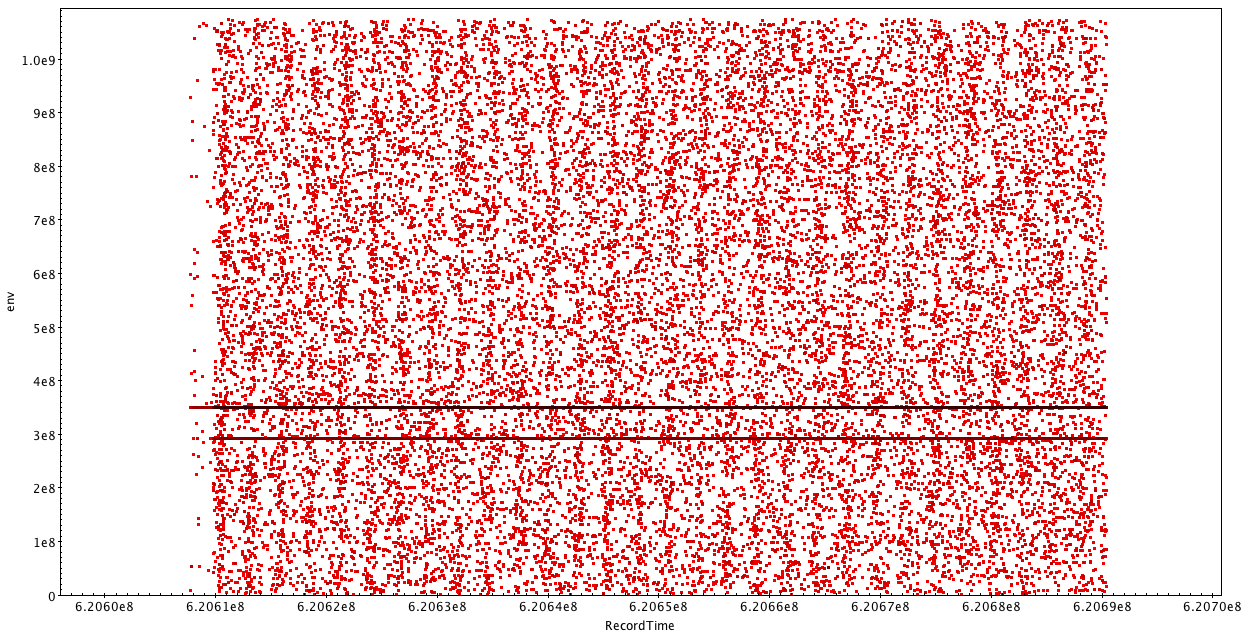
env vs Record time
We see events for which the env mode columns contains a value thus indicating that the env mode was enabled. We consider these as corrupted events.
For the unfiltered events.
1st set of eROdays
2nd set of eROdays
Subsec vs Record time
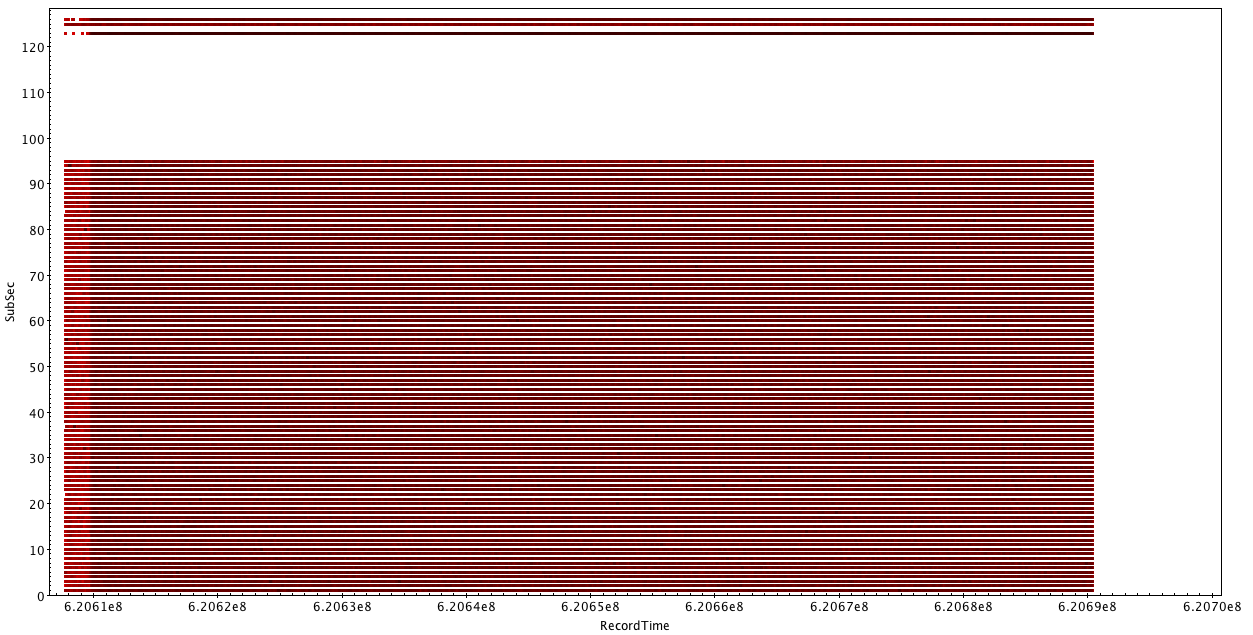
We find events for which the subseconds are above 95 and they appear "constantly". These events are typically data which have a non zero timesrc and datasrc and are currently removed after evprep.
For the unfiltered events.
1st set of eROdays
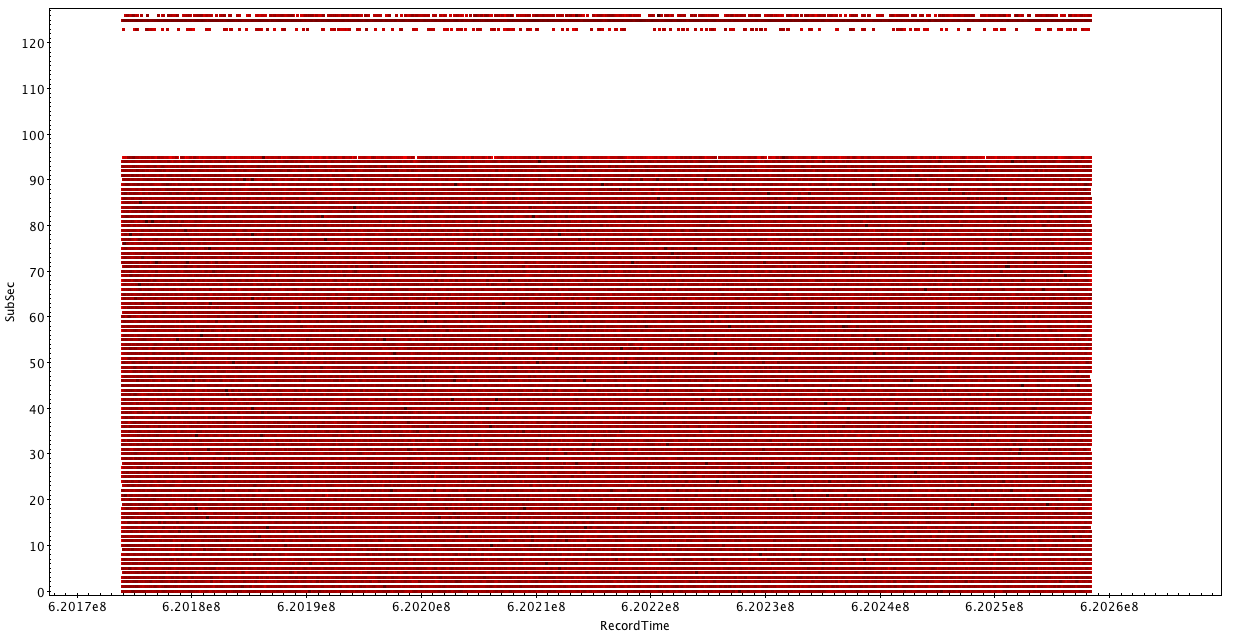
2nd set of eROdays
SCtime vs Record time
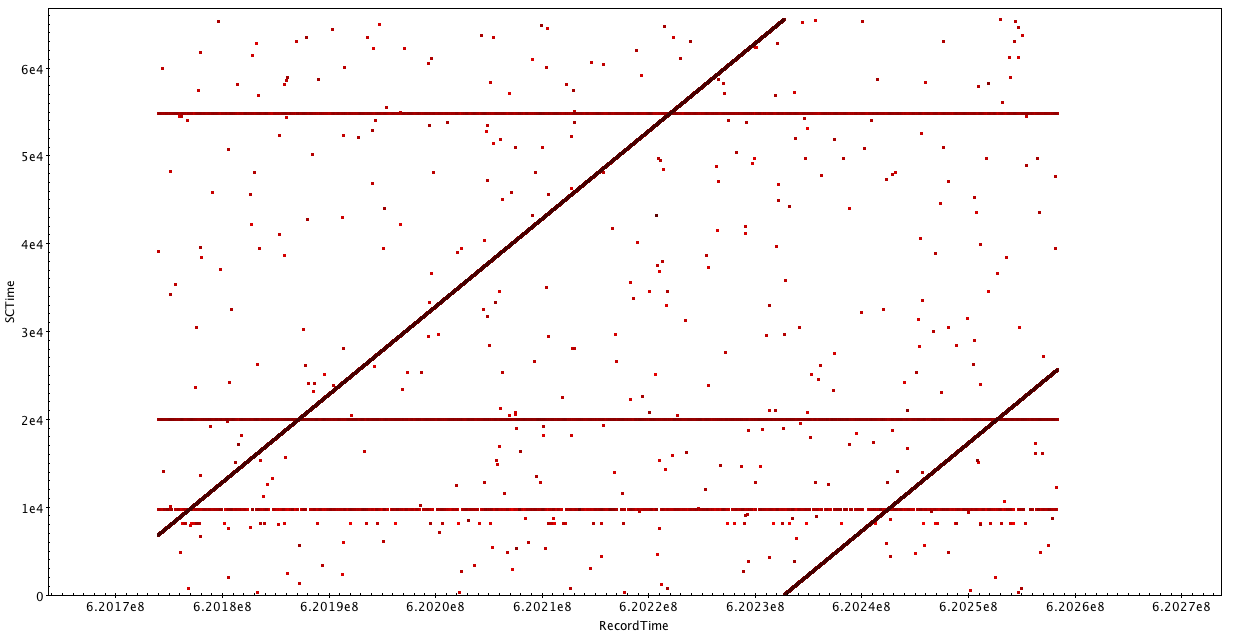
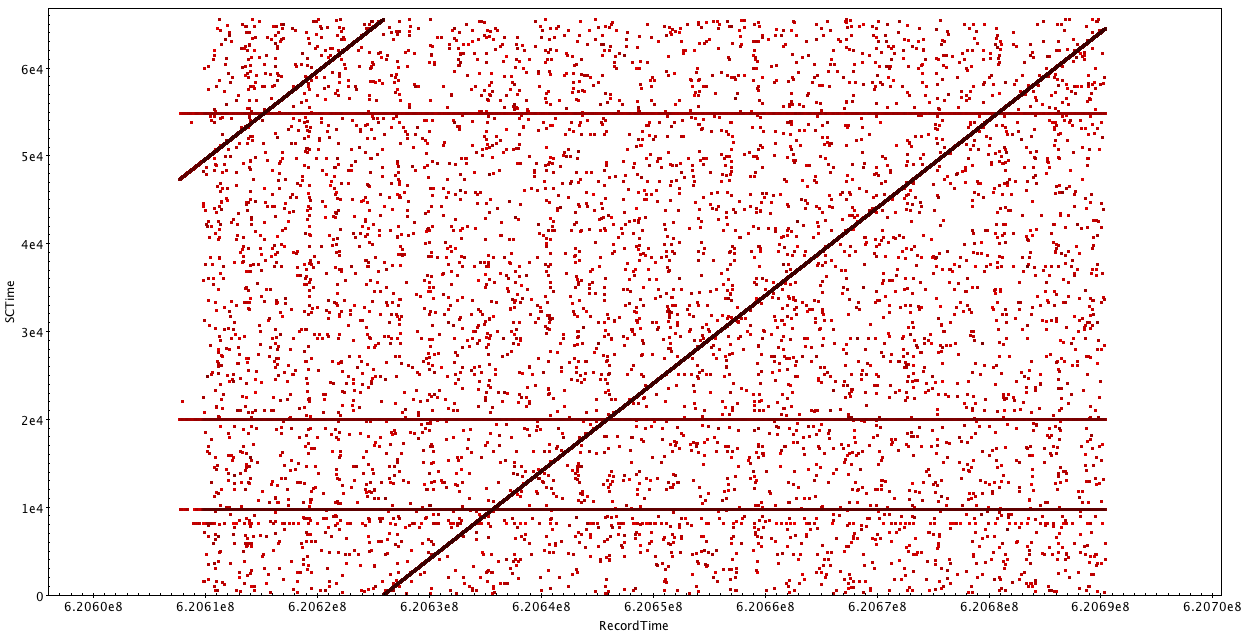
We would expect that the SCtime (the time info in the frame time in seconds) to increase with recordtime (diagonal) and after it reaches its limit resets. When investigating all received events we find that the SCtime indeed shows a diagonal as expected but also events with a "random" SCtime as well as events with specific values (lines in light curve). When applying the filters for "corrupted" events these are removed and only the diagonal remains.
For the unfiltered events.
1st set of eROdays
2nd set of eROdays
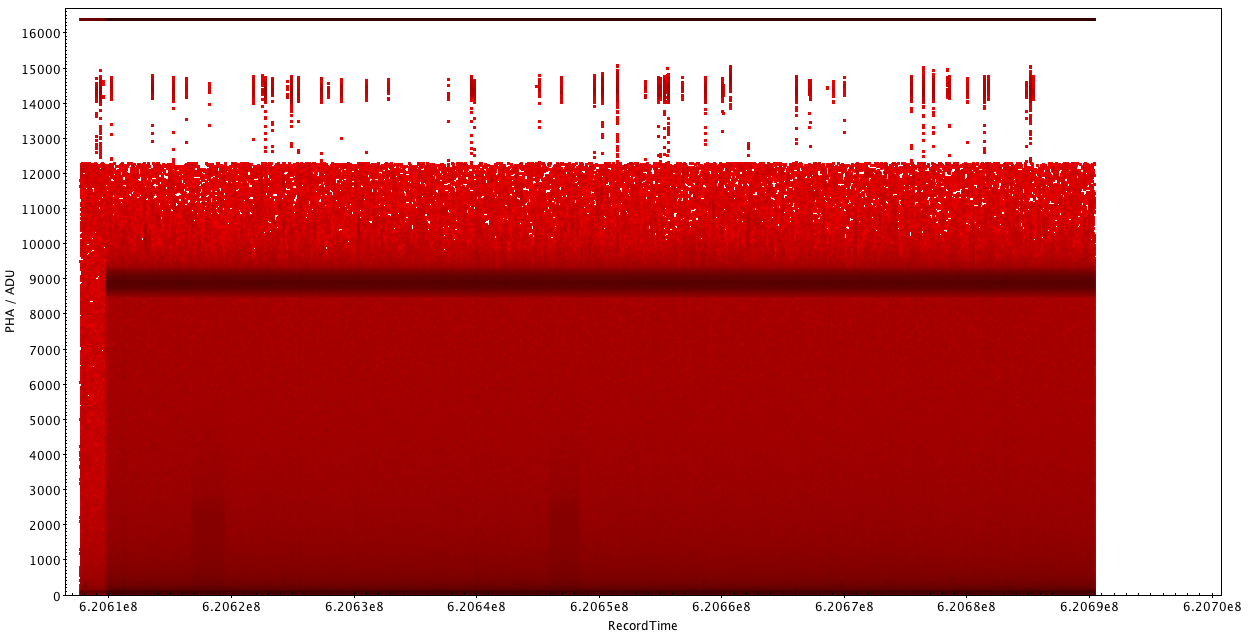
PHA/ADU vs Record time
For the unfiltered events.
1st set of eROdays
2nd set of eROdays
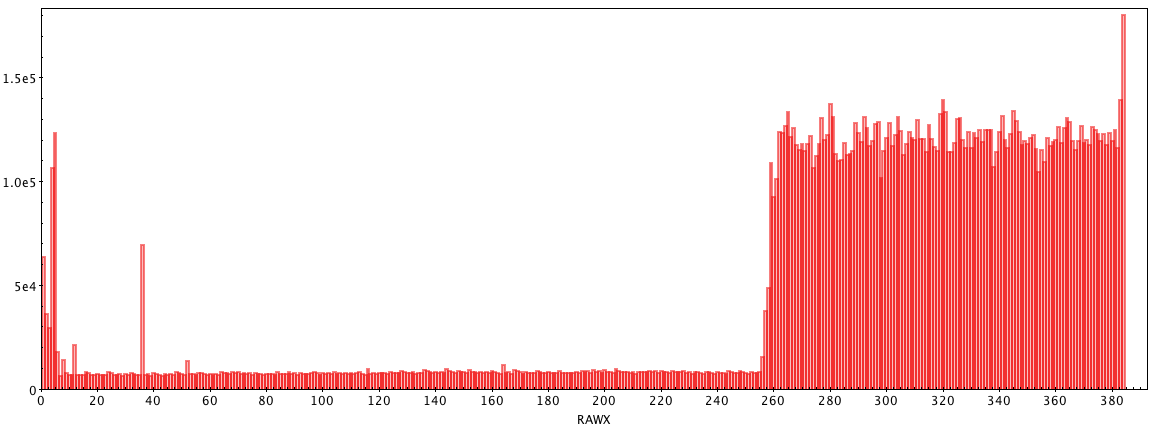
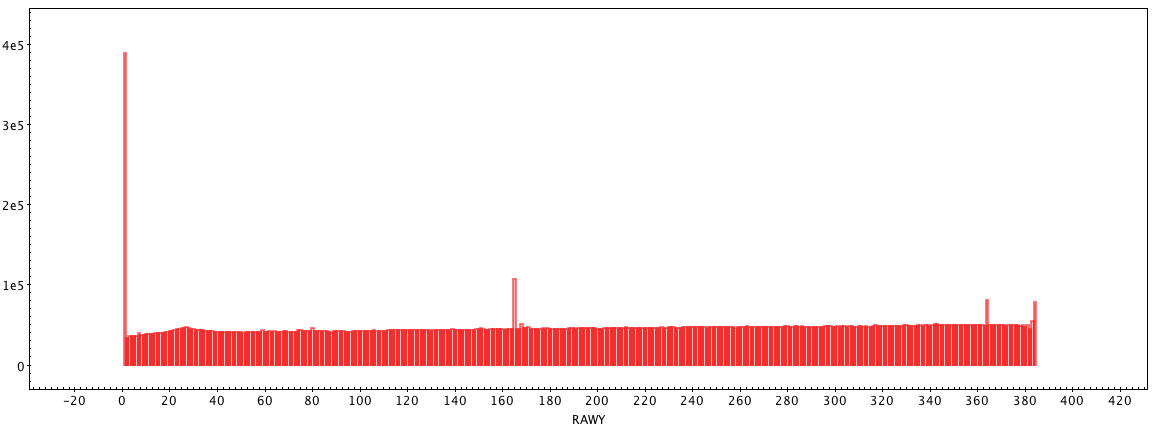
RAWX and RAWY histograms
For the unfiltered events.
RAWX
RAWY
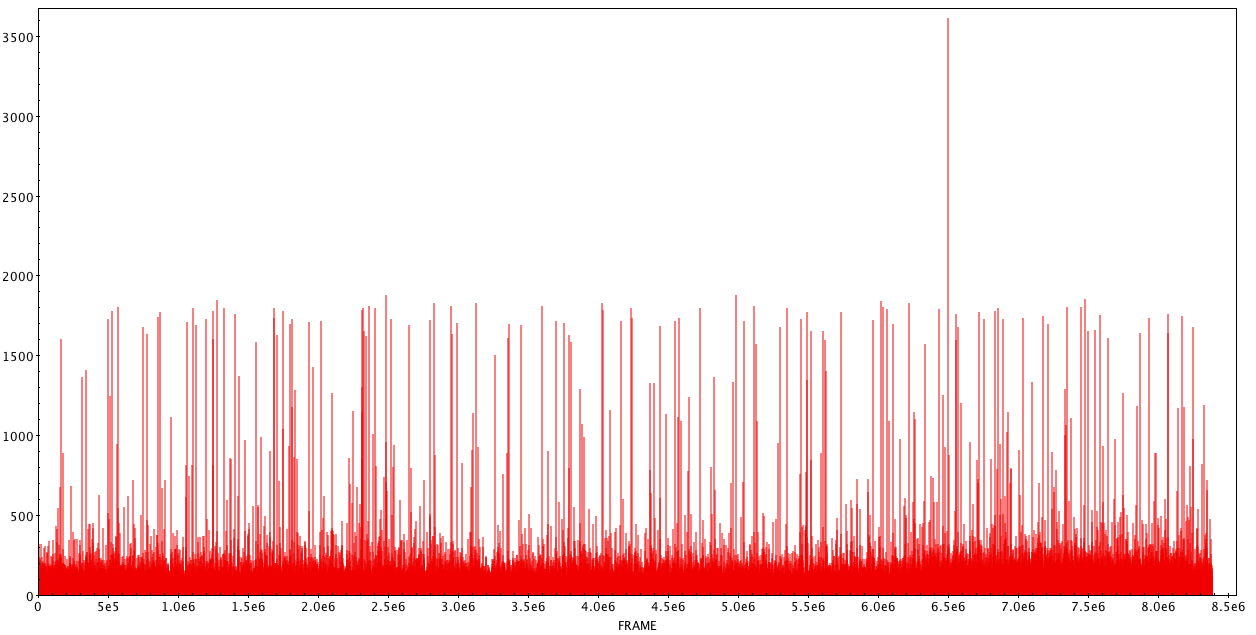
Histogram of Frames
Comment / Description
The histograms below are in bins of 1 frame. This should show that we have received frames, which show more events than the expected quota. The current limit of the eventquota was set to 200. The analysed data covered the frames for a total of 3 times. Thus if we find frames with more than 600 events, at least in one of frames we have an excess of events.
We also see that even after removing events (see filter settings) and duplicates the spikes in the histogram remain.
Open Questions / Items
Does the eventquota procedure work as intended? In this dataset we are not ably to answer this question since the eventquota behaviour will only trigger after a certain number of consecutive frames (we think 4) exceed the limits. Here we typically observe a single frame and sometimes a consecutive frame exceeding the limit. This needs further investigation.
What are the spikes? We still do not know yet, but more on the nature of these events in the next section about light curves (recordtime).
Unfiltered events

Filtered events
Comparison with (some) HK parameters)
HK1
EVTCTR jumps
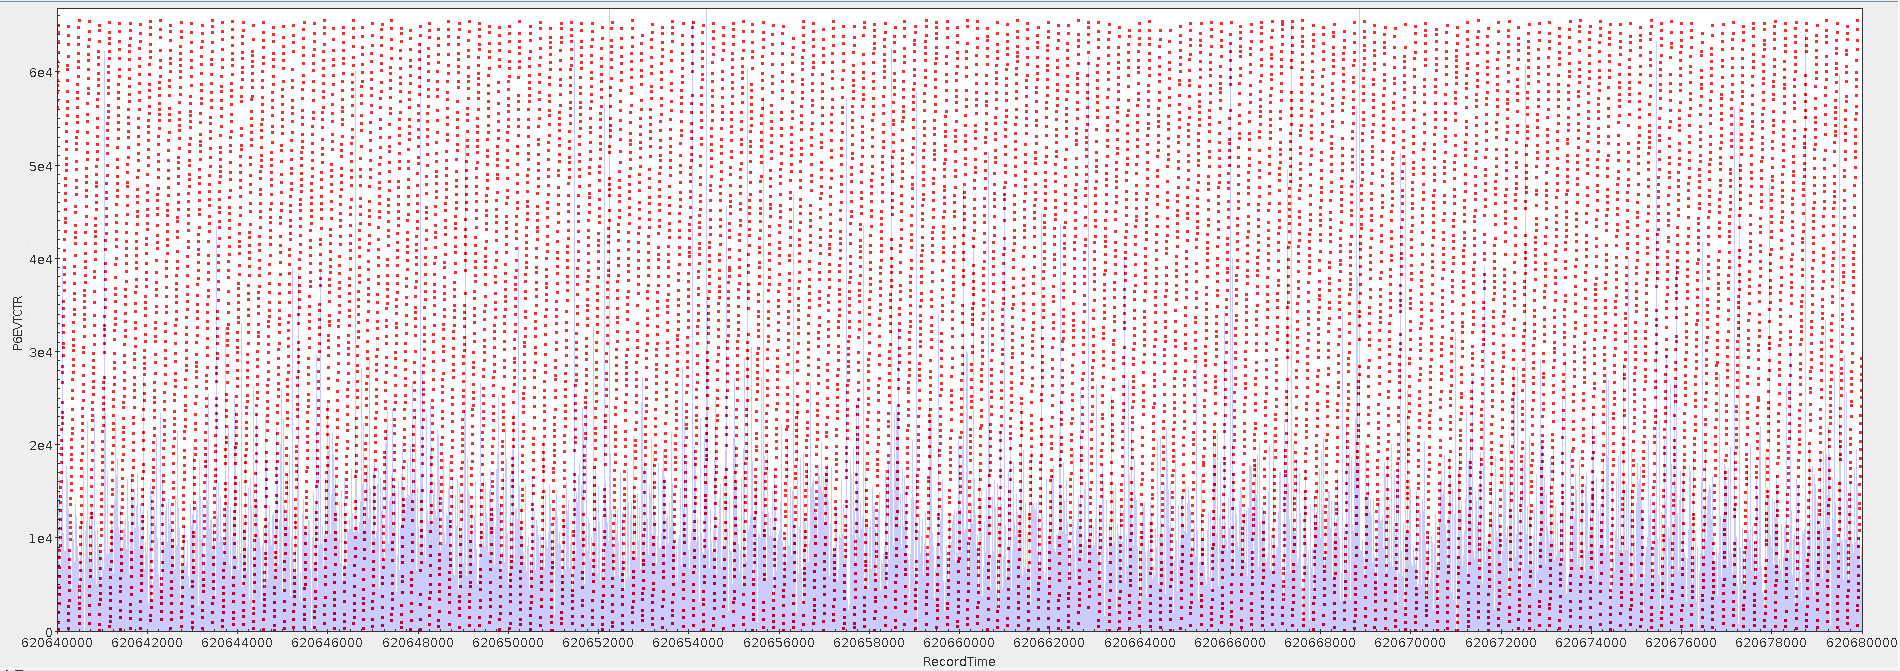
BITERR variation
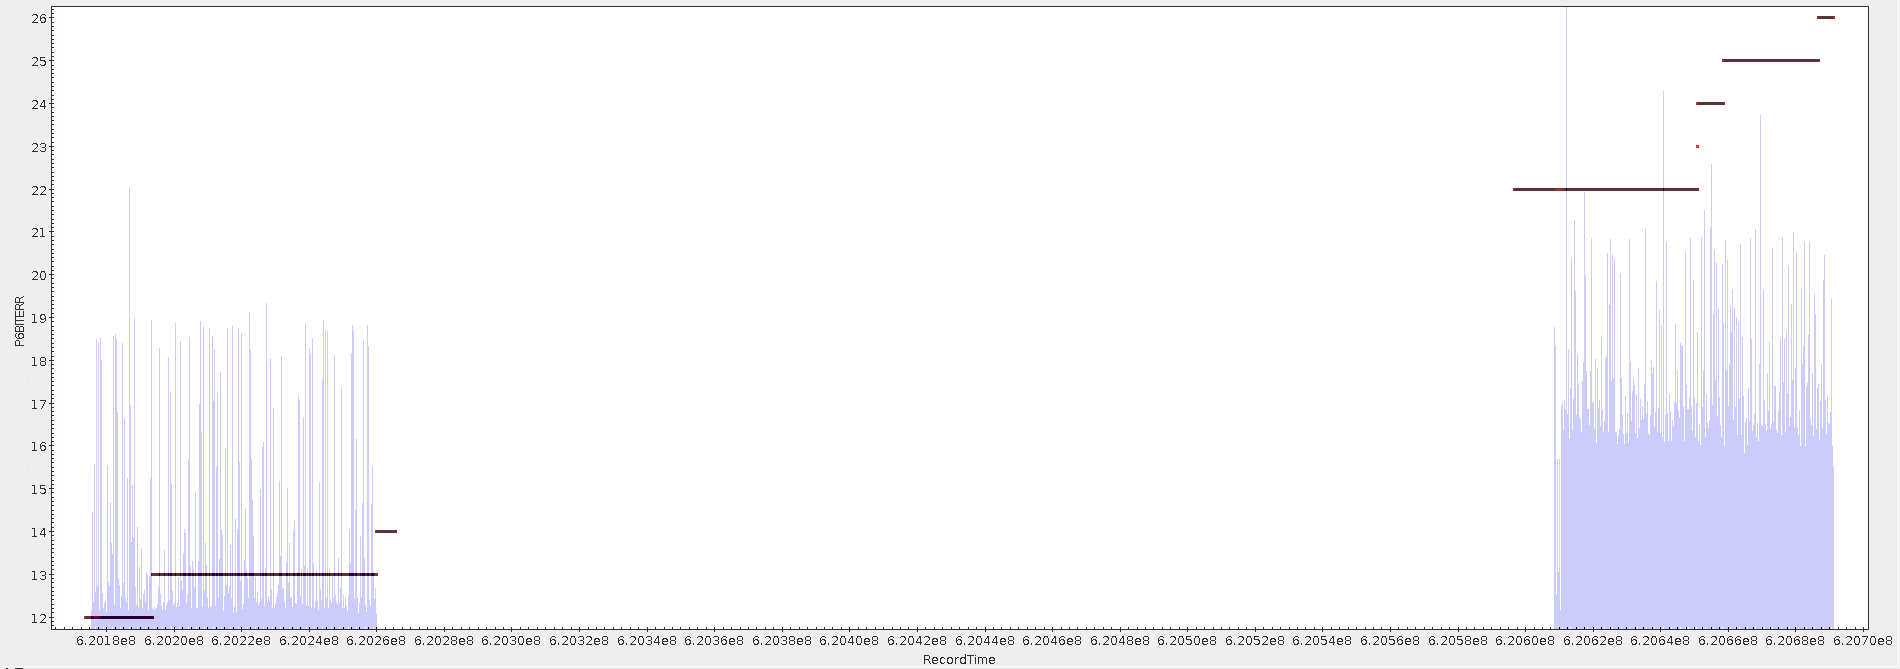
LOWHKHI variation
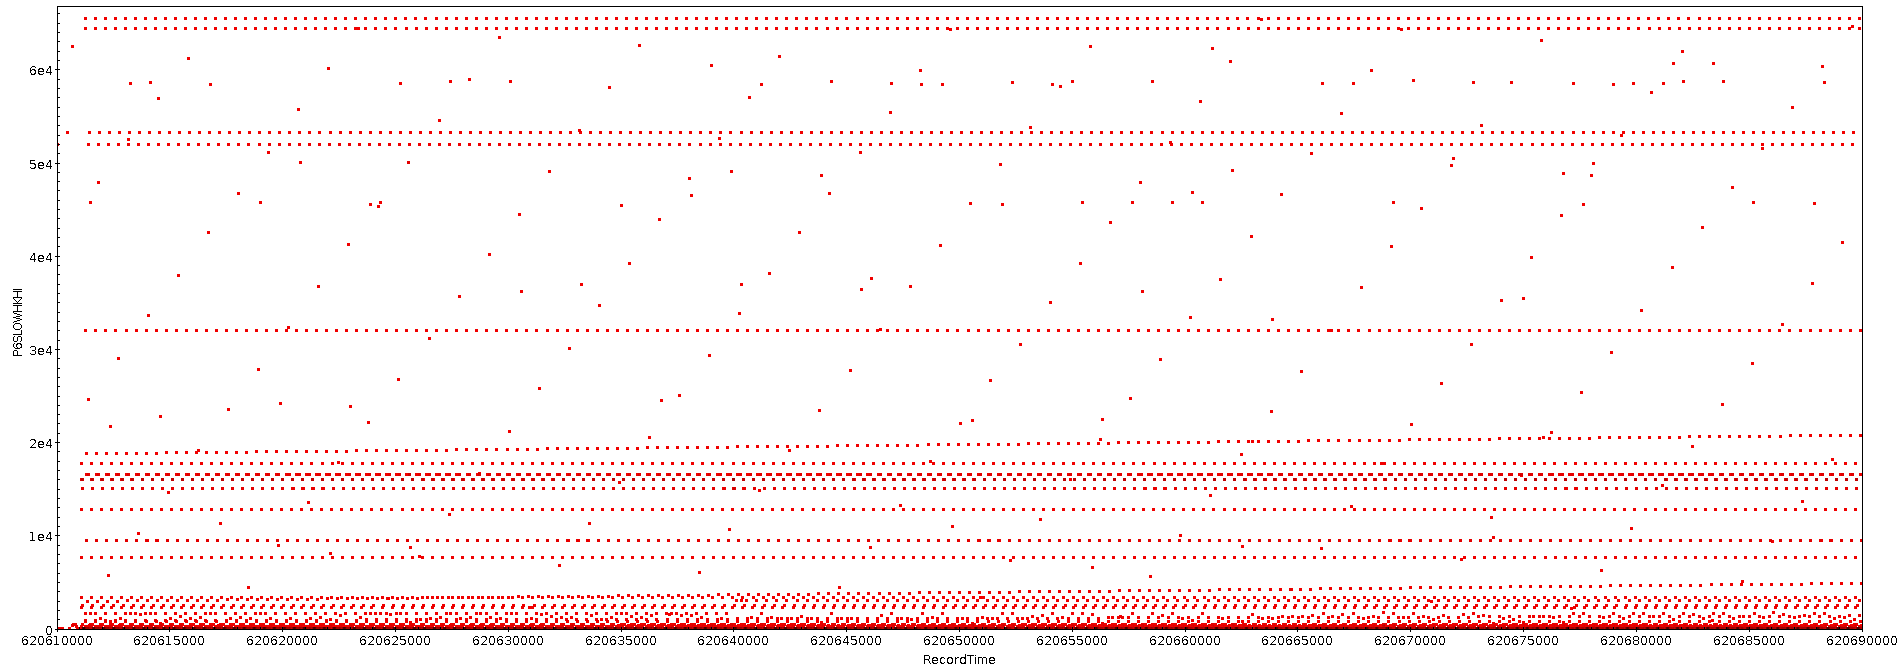
LOWHKLO shows an even more erratic behaviour.
HK3
Subsec jumps
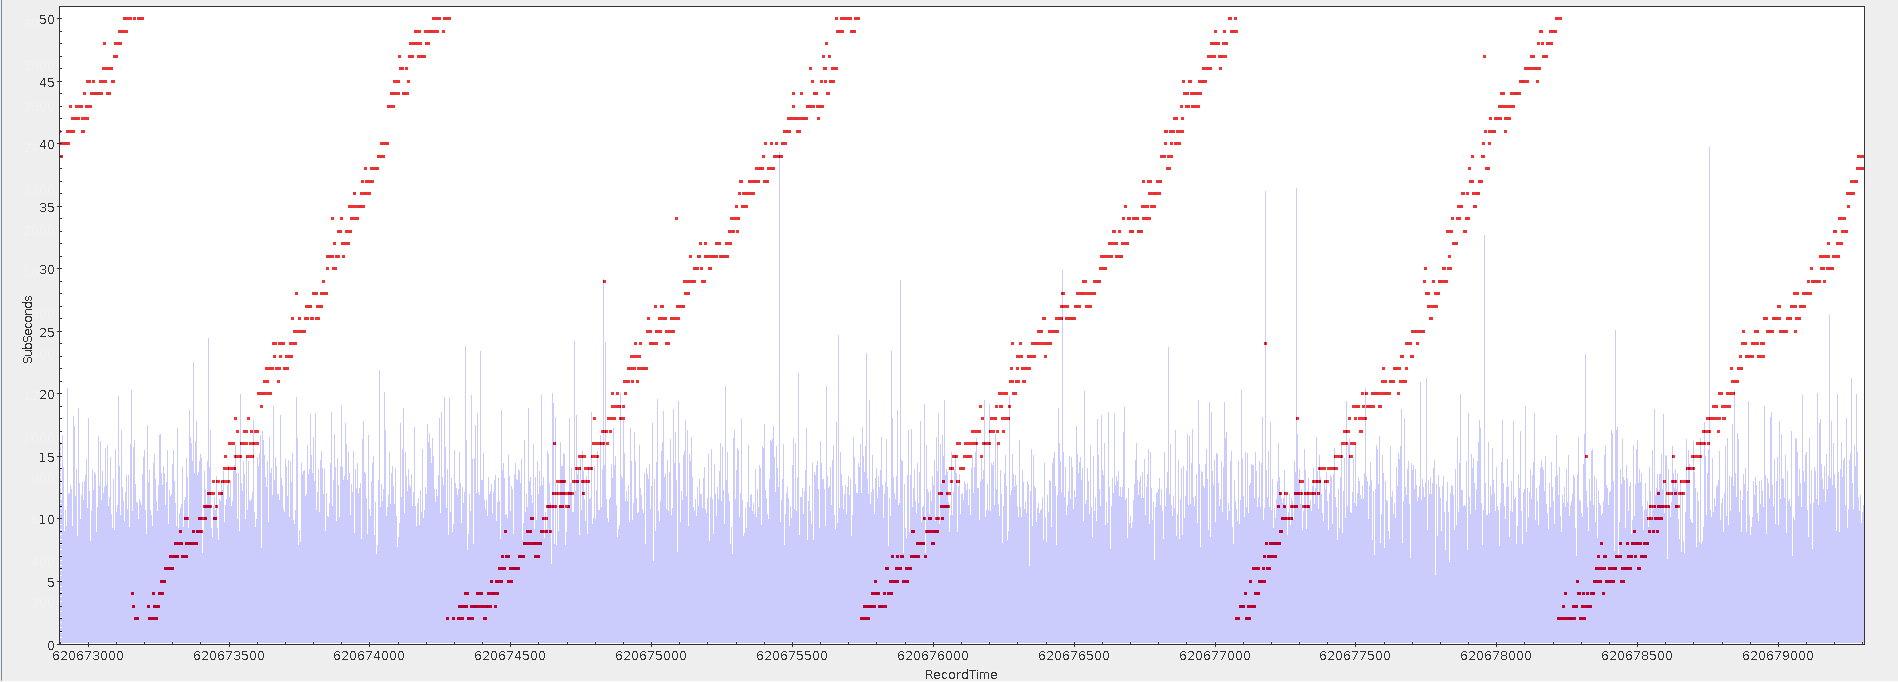
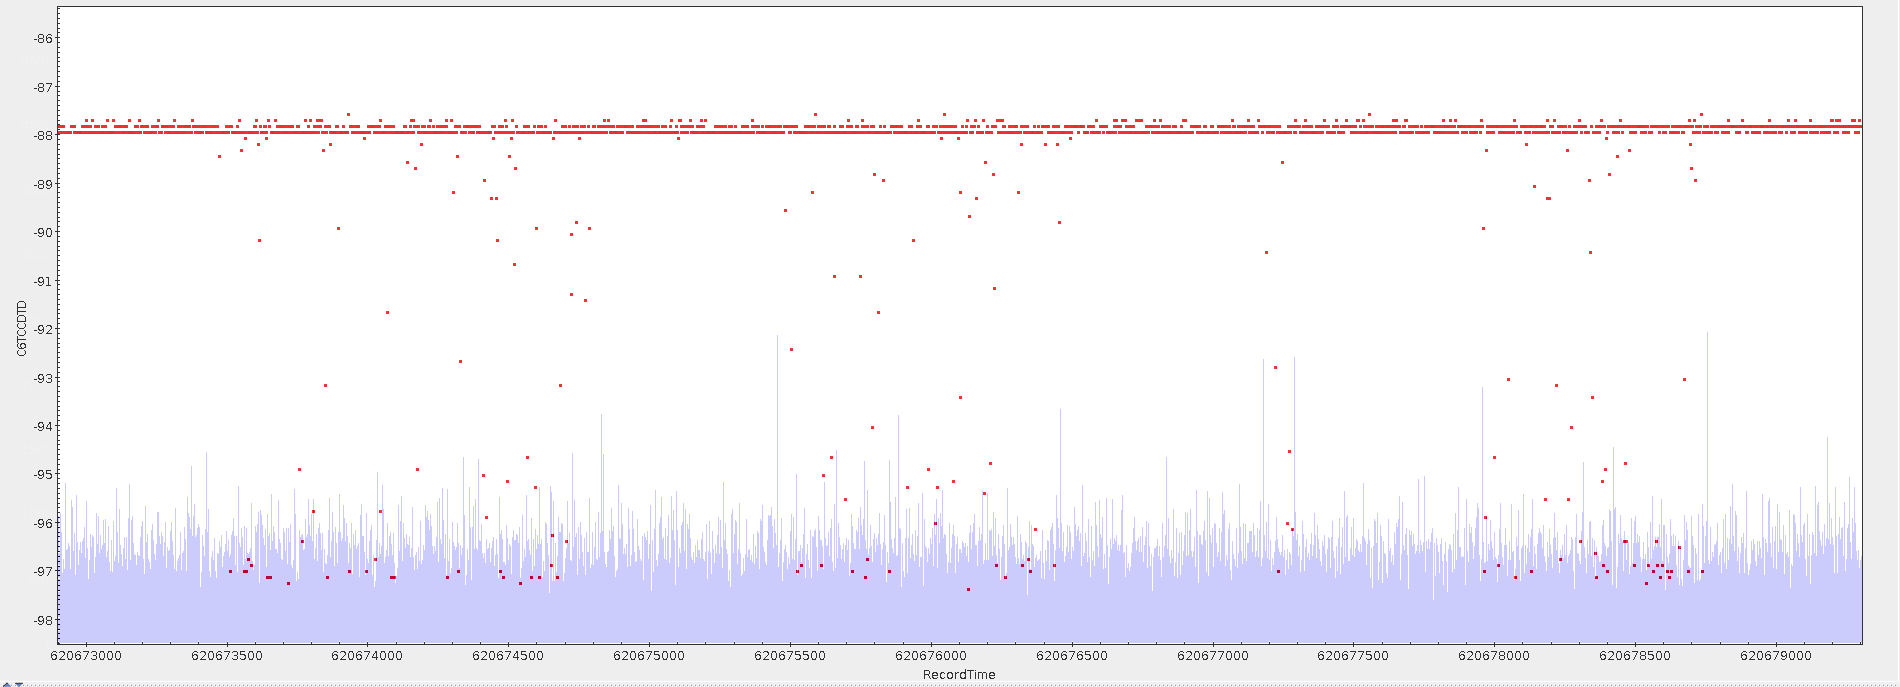
TCCDTD variation
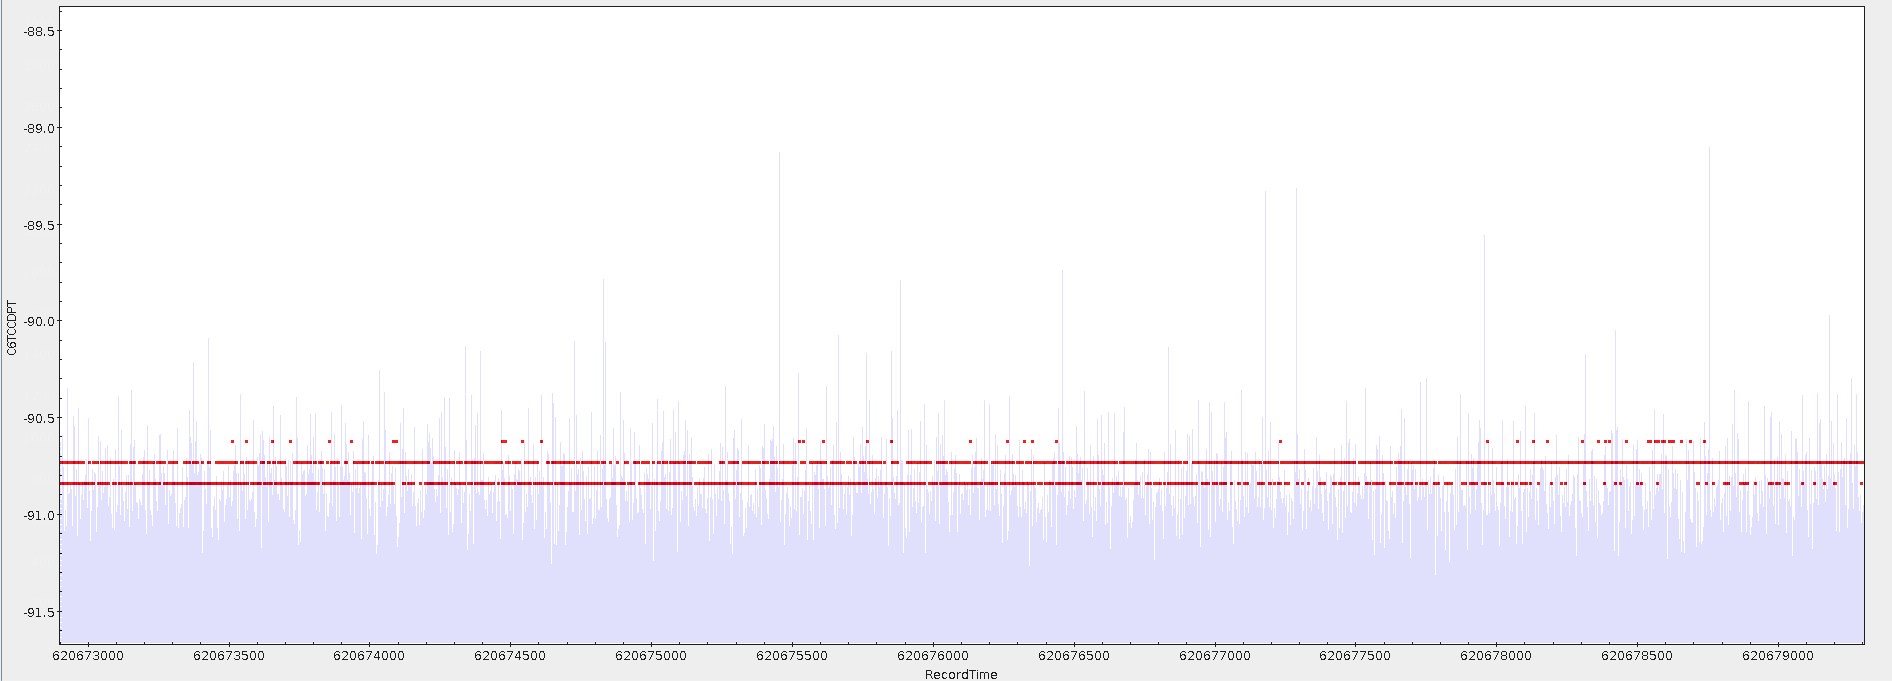
TCCDPT variation
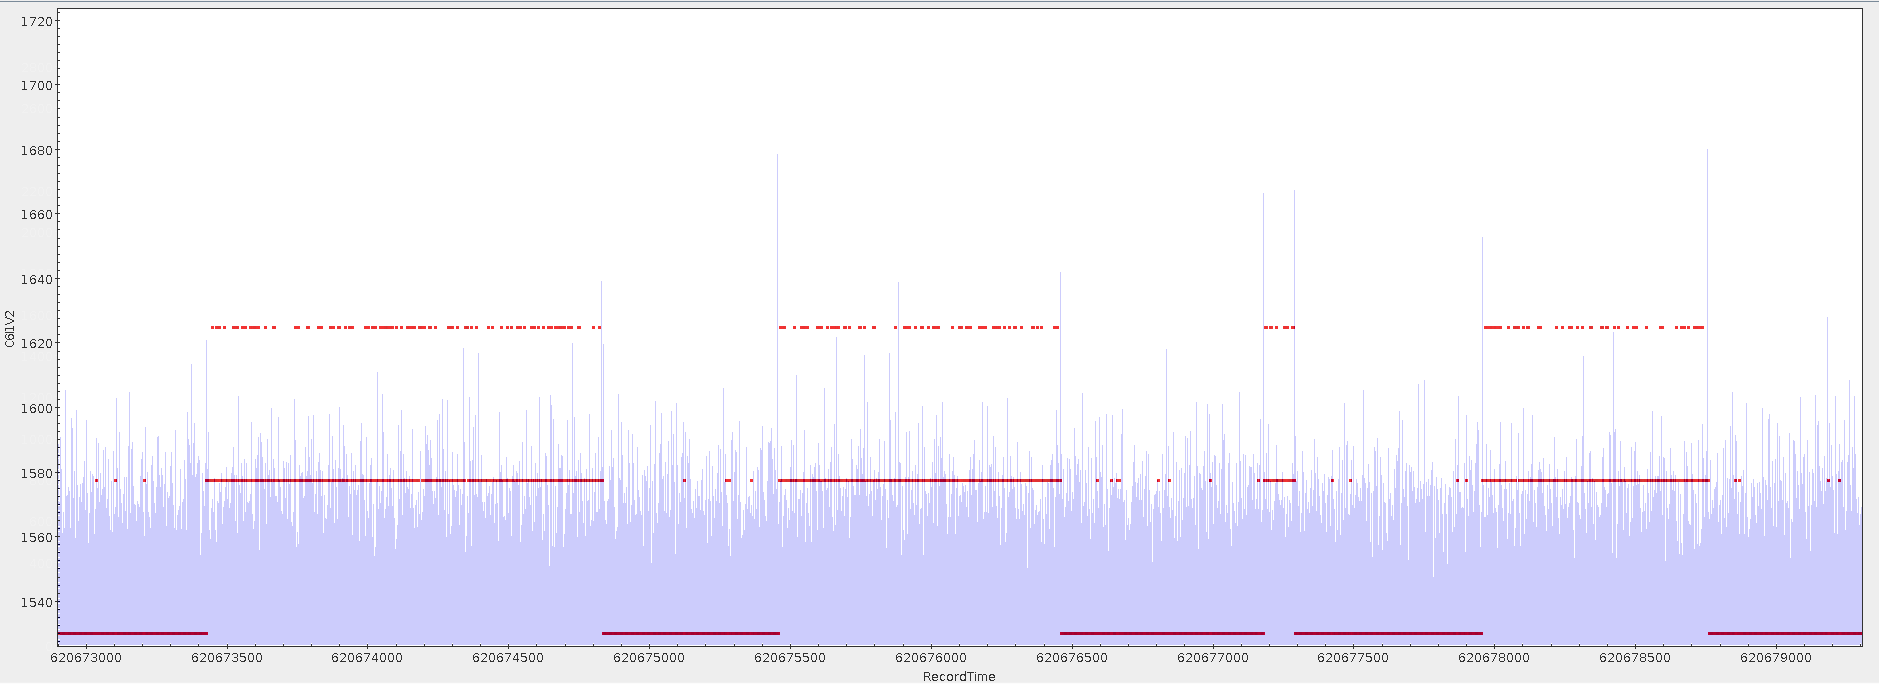
I1V2 variation
HK5
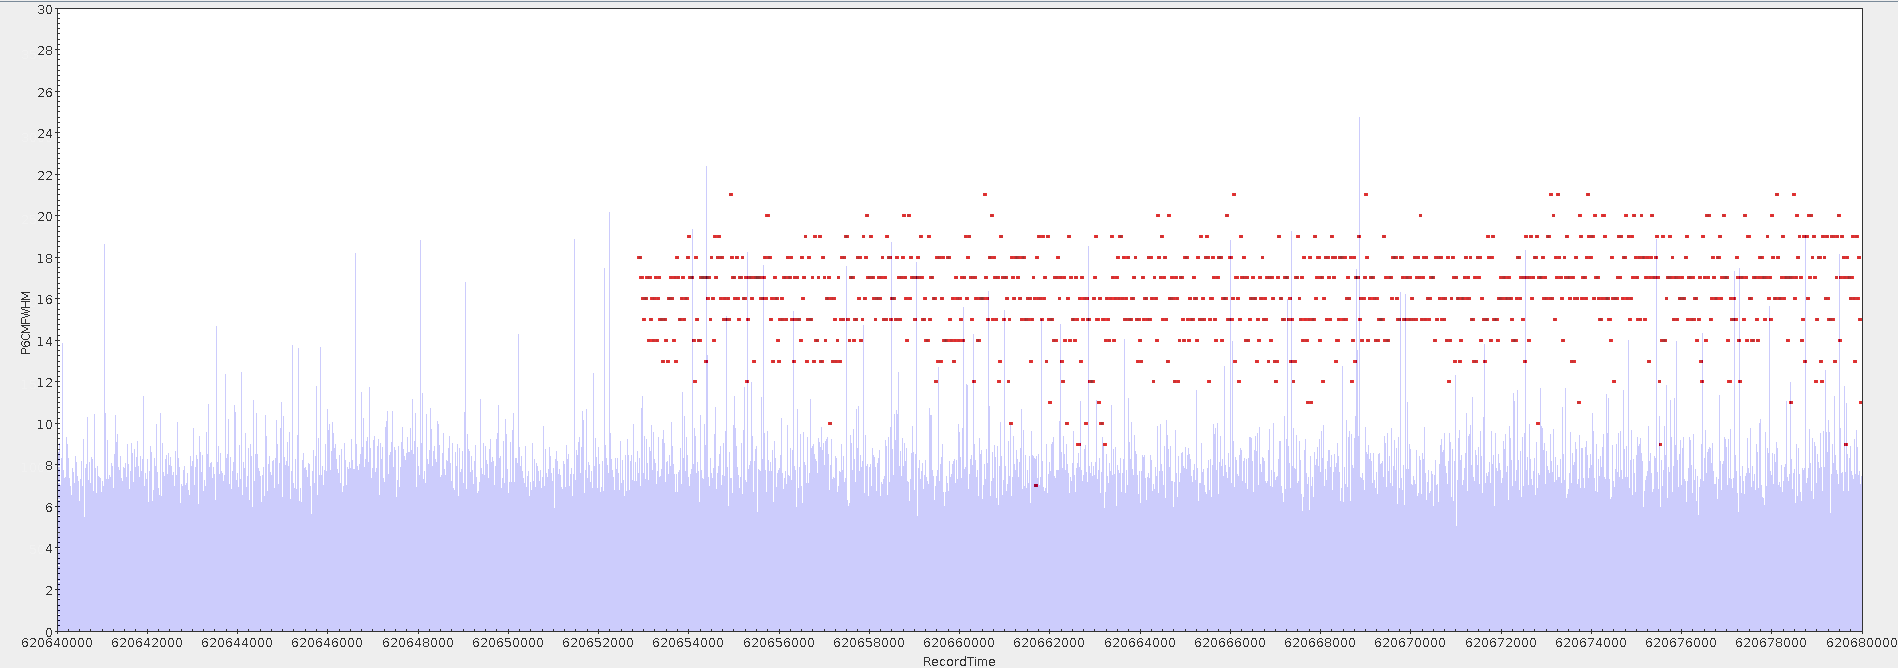
CMFWHM jump
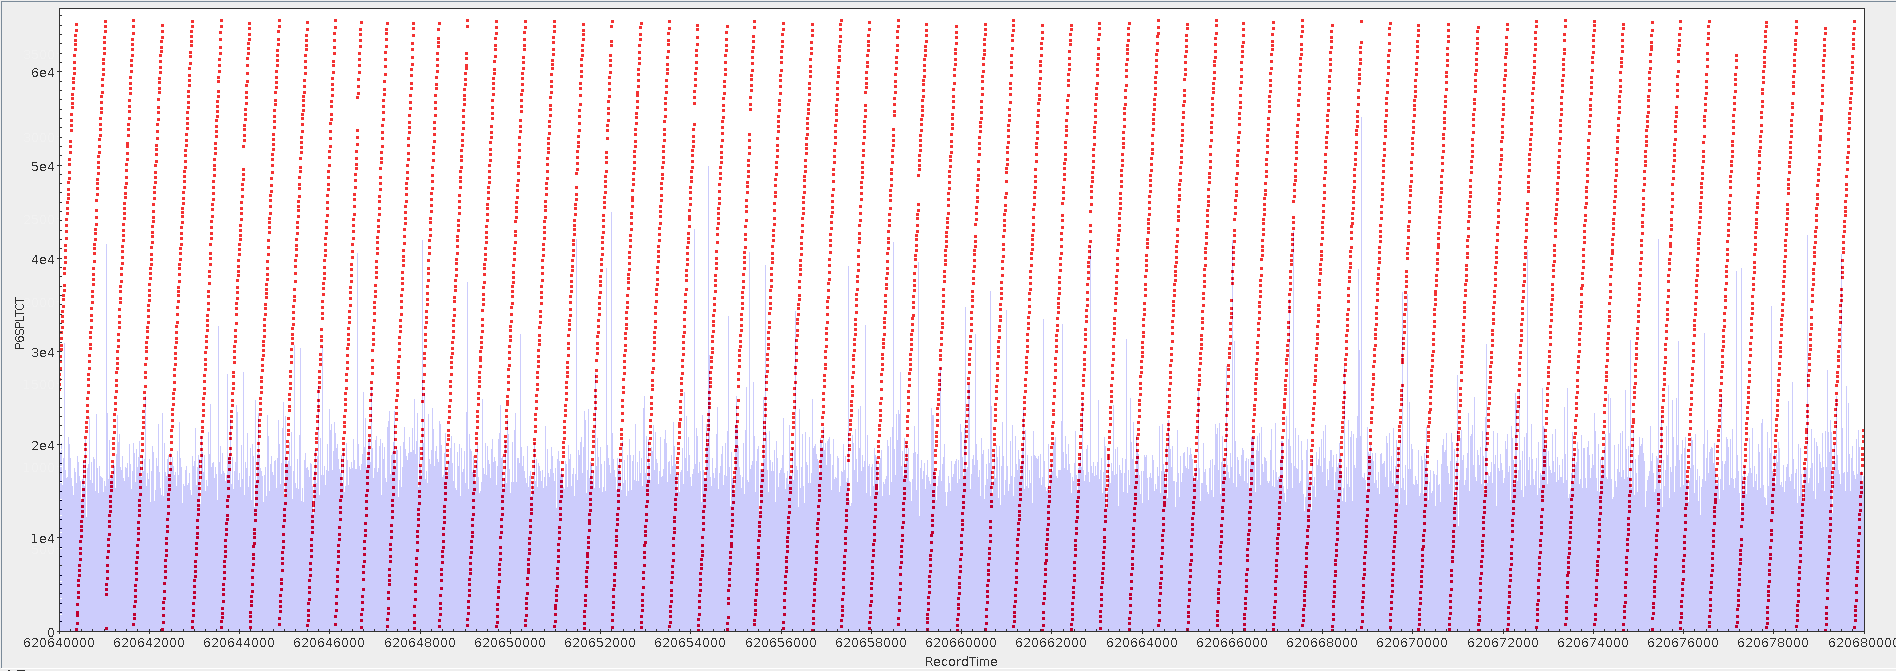
SPLTCT jumps
EVTBMAX match
