Checked eROdays
eROday |
Date - Time (UTC) |
TSTART |
TSTOP |
ZZZ |
WWW |
|
|
43068 |
2019-08-26 T16:59:55 |
6.201648e8 |
6.201792e8 |
|
|
|
43069 |
2019-08-26 T20:59:55 |
6.201782e8 |
6.201936e8 |
|
|
|
43070 |
2019-08-27 T00:59:55 |
6.201936e8 |
6.202080e8 |
|
|
|
43071 |
2019-08-27 T04:59:55 |
6.202080e8 |
6.202224e8 |
|
|
|
43072 |
2019-08-27 T08:59:55 |
6.202224e8 |
6.202368e8 |
|
|
|
43073 |
2019-08-27 T12:59:55 |
6.202368e8 |
6.202512e8 |
|
|
|
43074 |
2019-08-27 T16:59:55 |
6.202512e8 |
6.202583e8 |
|
|
|
43098 |
2019-08-31 T16:59:55 |
6.206077e8 |
6.206112e8 |
|
|
|
43099 |
2019-08-31 T20:59:55 |
6.206112e8 |
6.206256e8 |
|
|
|
43100 |
2019-09-01 T00:59:55 |
6.206256e8 |
6.206400e8 |
|
|
|
43101 |
2019-09-01 T04:59:55 |
6.206400e8 |
6.206544e8 |
|
|
|
43102 |
2019-09-01 T08:59:55 |
6.206544e8 |
6.206688e8 |
|
|
|
43103 |
2019-09-01 T12:59:55 |
6.206688e8 |
6.206832e8 |
|
|
|
43104 |
2019-09-01 T16:59:55 |
6.206832e8 |
6.206904e8 |
|
|
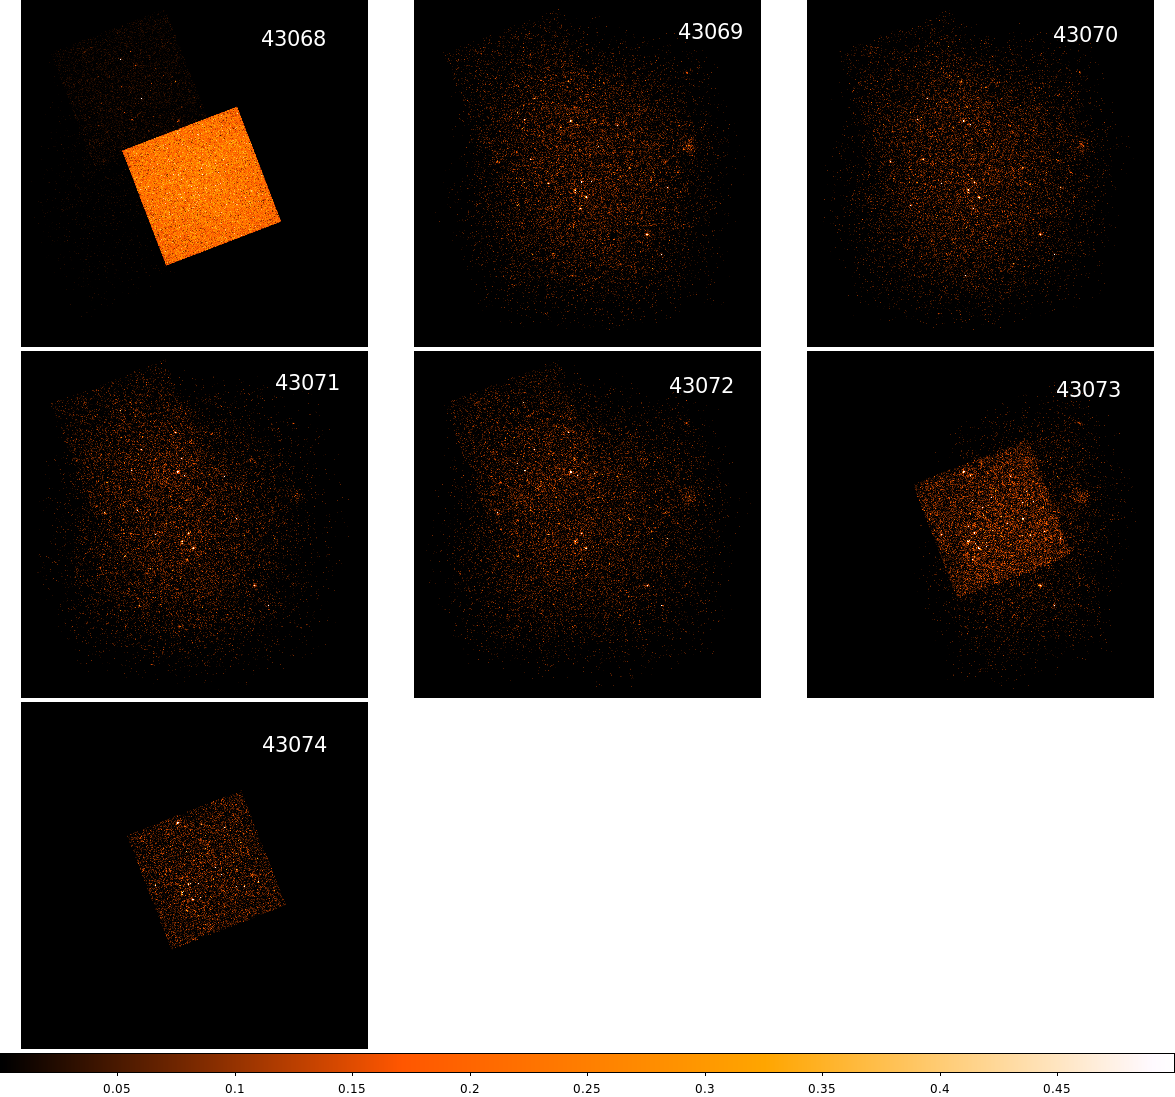
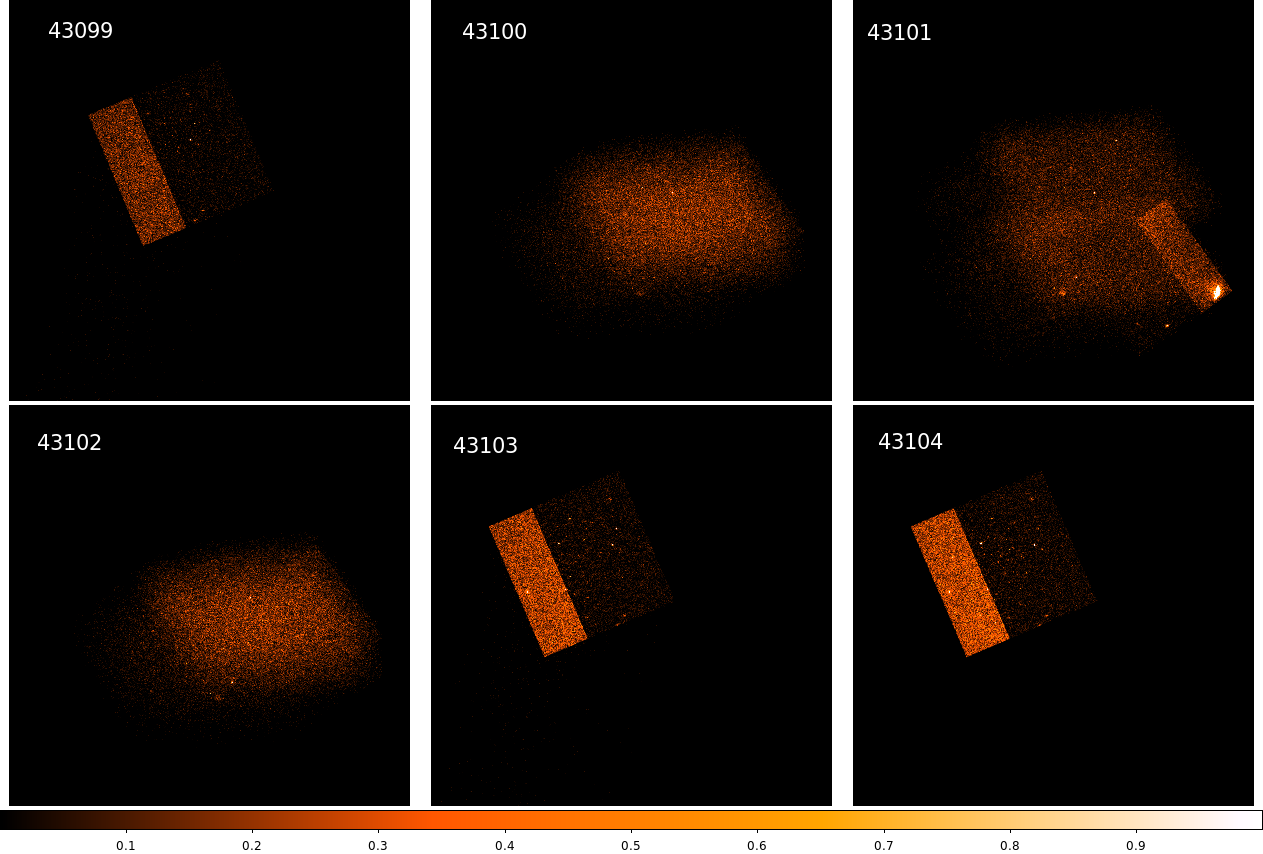
Photon image of the eROdays
Images in the 0.2-10 keV energy band.
Lost data
1st set of eROdays
Duplicated events: ~5%
Weird data *): ~3.5%
env-mode: ~0.7%
2nd set of eROdays
Duplicated events: ~11%
Weird data *): ~7-8%
env-mode: ~1.3%
*) time source or data source not equal 0
Histogram of Frames
Comment / Description
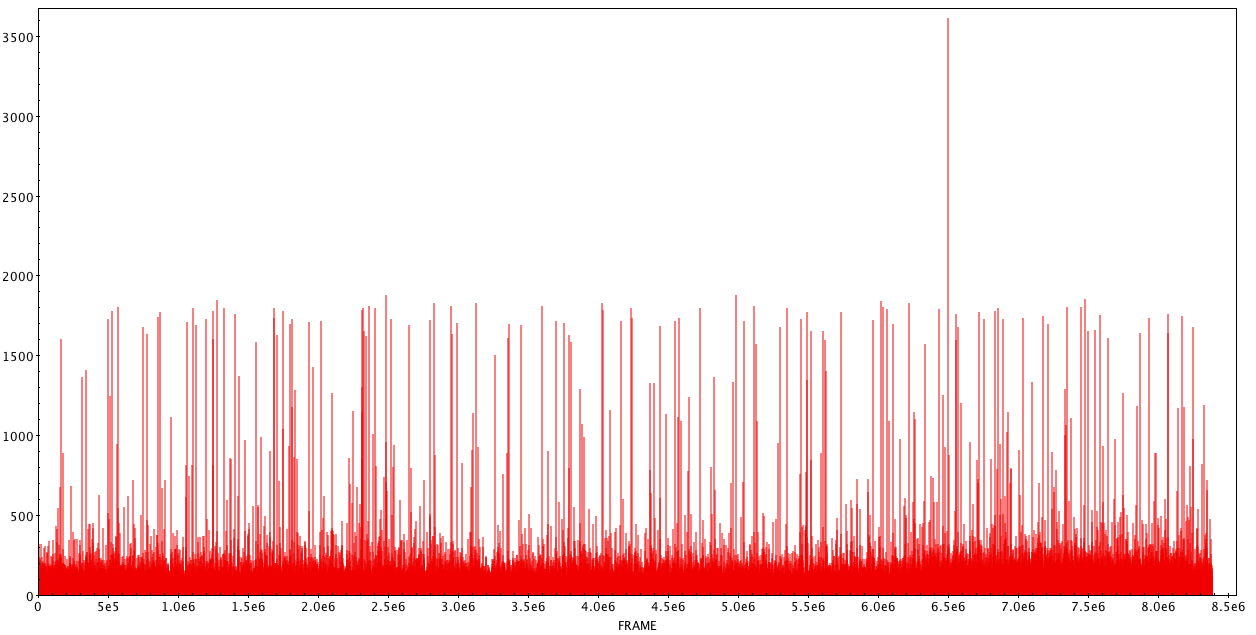
The histograms below are in bins of 1 frame. This should show that we have received frames, which show more events than the expected quota. The current limit of the eventquota was set to 200. The analysed data covered the frames for a total of 3 times. Thus if we find frames with more than 600 events, at least in one of frames we have an excess of events.
We also see that even after removing events (see filter settings) and duplicates the spikes in the histogram remain.
Open Questions / Items
Does the eventquota procedure work as intended? In this dataset we are not ably to answer this question since the eventquota behaviour will only trigger after a certain number of consecutive frames (we think 4) exceed the limits. Here we typically observe a single frame and sometimes a consecutive frame exceeding the limit. This needs further investigation.
What are the spikes? We still do not know yet, but more on the nature of these events in the next section about light curves (recordtime).
Unfilter events

Filtered events
Record time light curves
Comment / Description
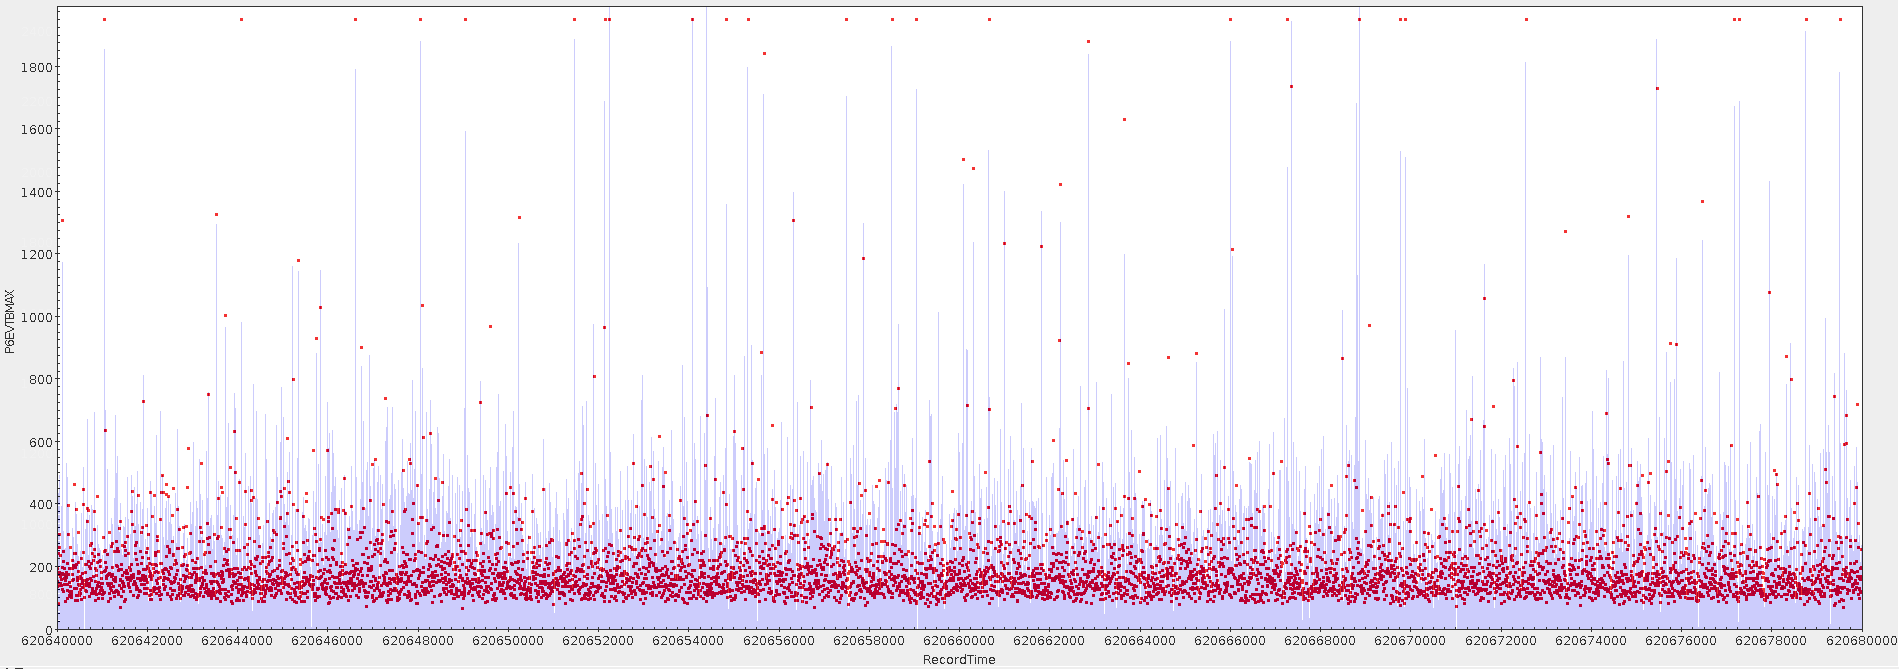
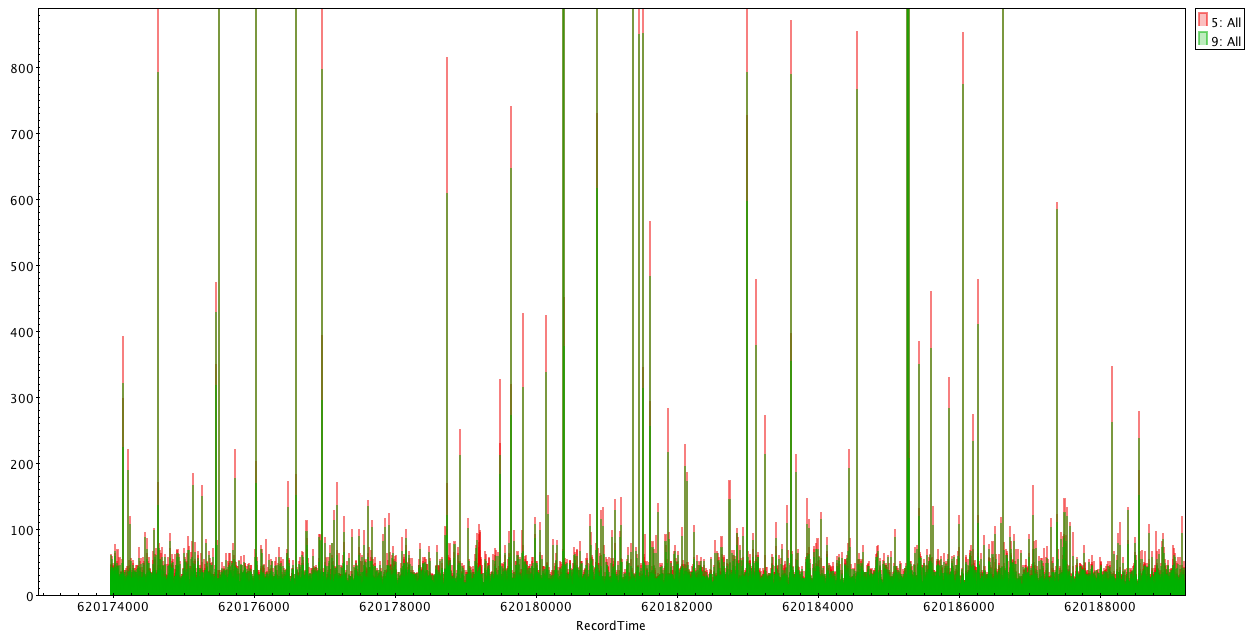
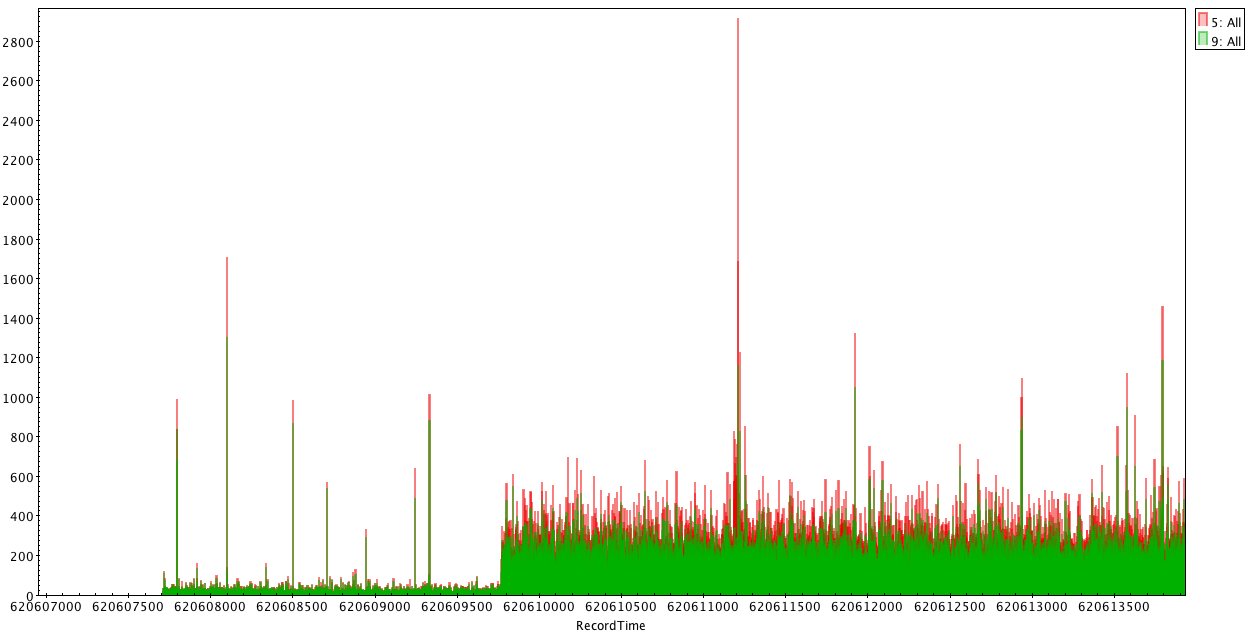
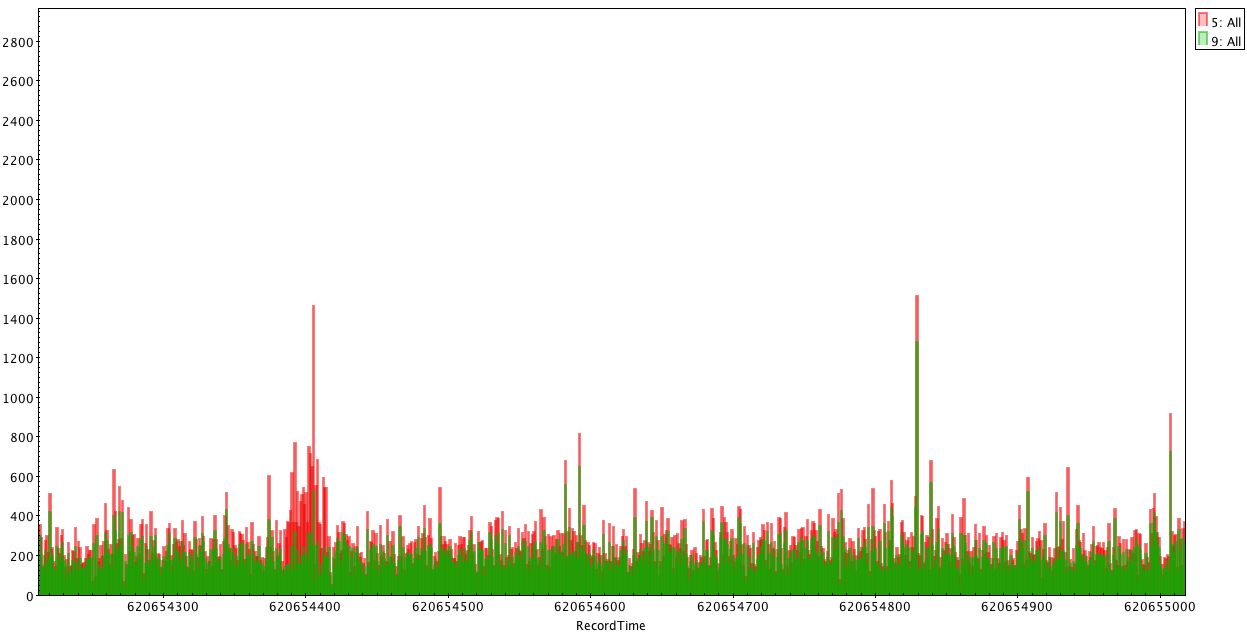
Lightcurves (recordtime) before and after filtering. RecordTime (high resolution creation of the record, calculated from EXT_OTS, INT_OTS, SCTime, SubSec) for more details ask Ingo or see https://erosita.mpe.mpg.de/eROdoc/raw/rawFitsFileFormats_2018-08.html
We find spikes in the lightcurves which are not removed event after the initial filter stage.
Red: unfiltered; Green: filtered. Both histograms are a zoom!
1st set of eROdays
2nd set of eROdays
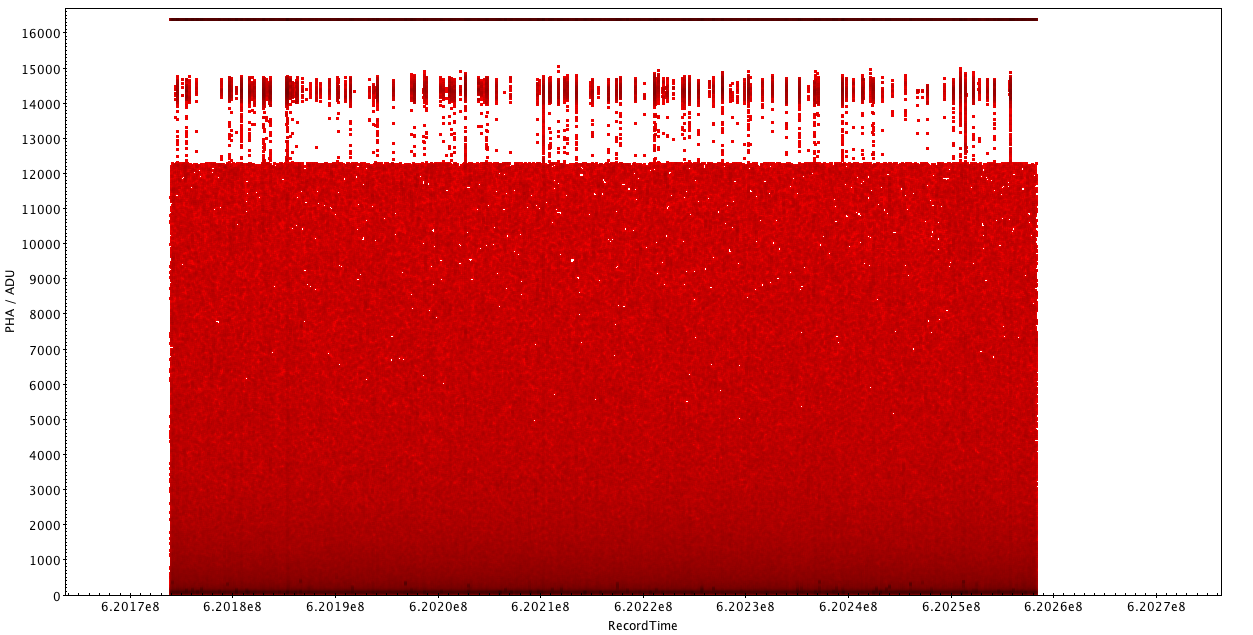
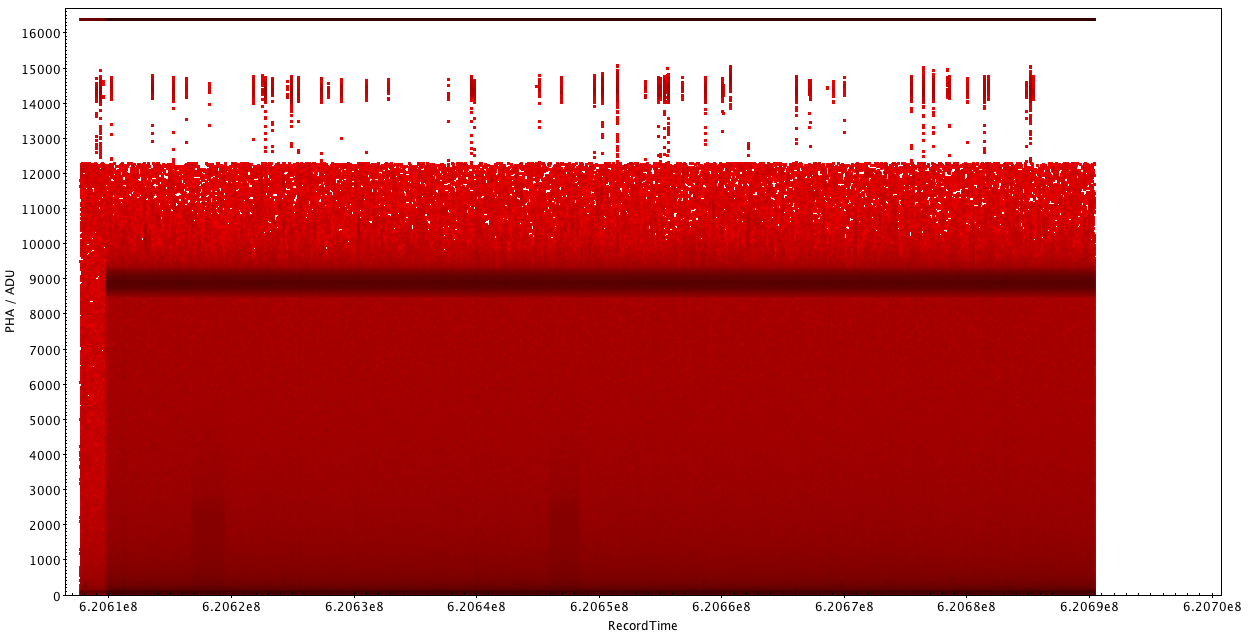
PHA/ADU vs Record time
For the unfiltered events.
1st set of eROdays
2nd set of eROdays
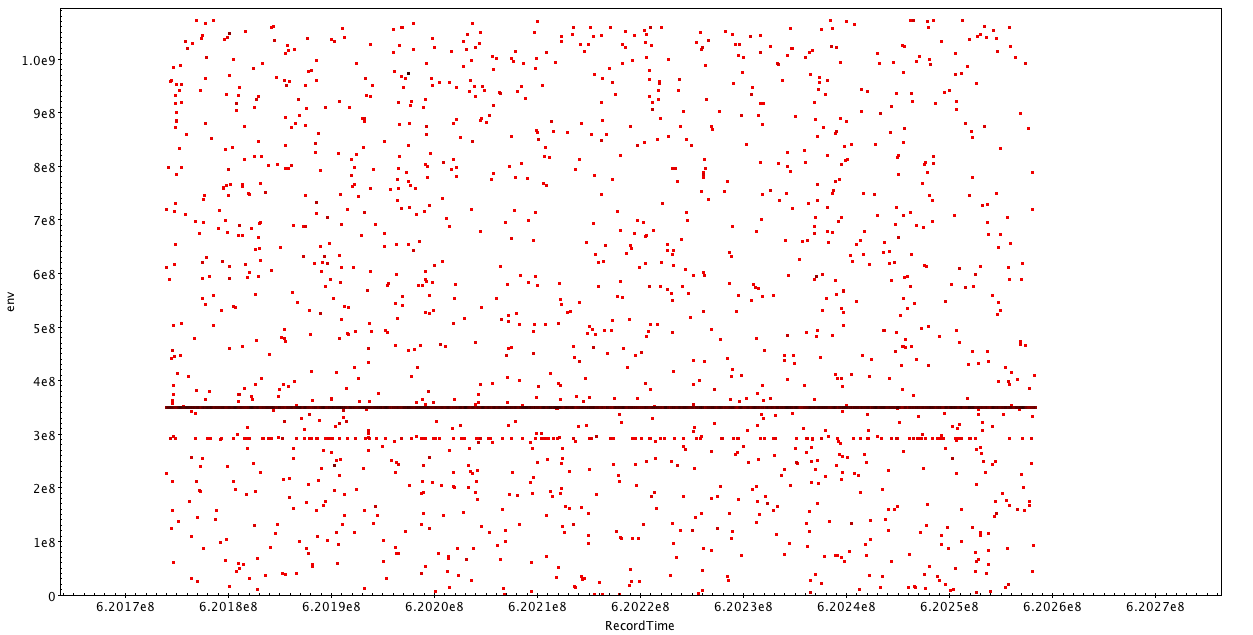
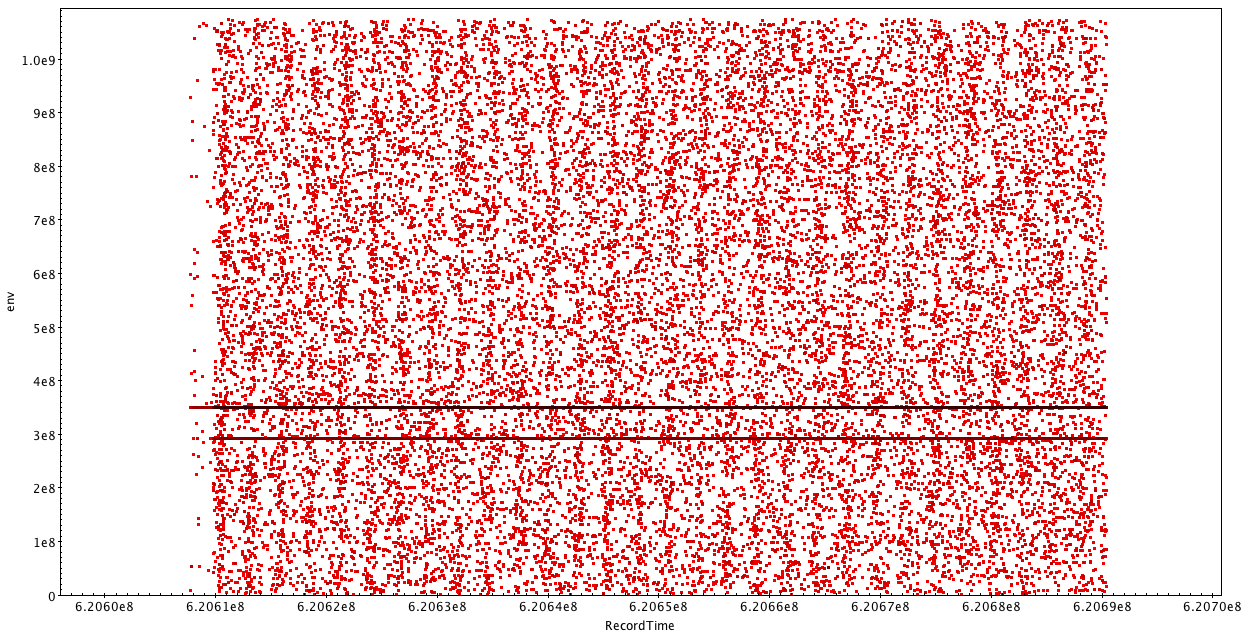
env vs Record time
For the unfiltered events.
1st set of eROdays
2nd set of eROdays
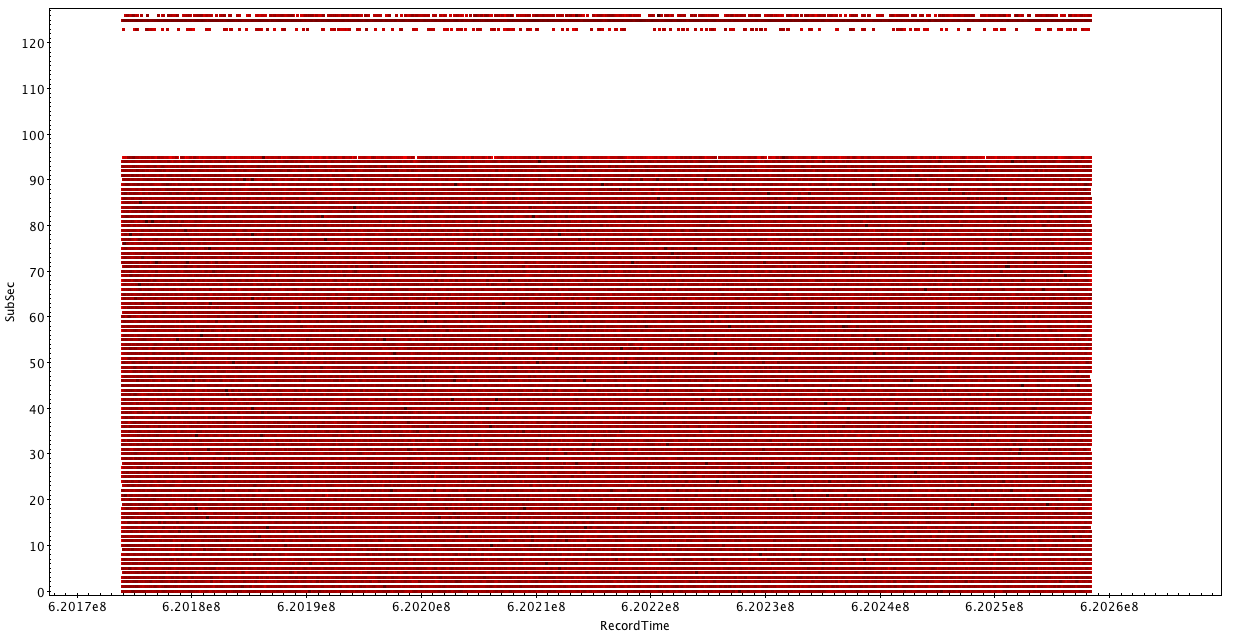
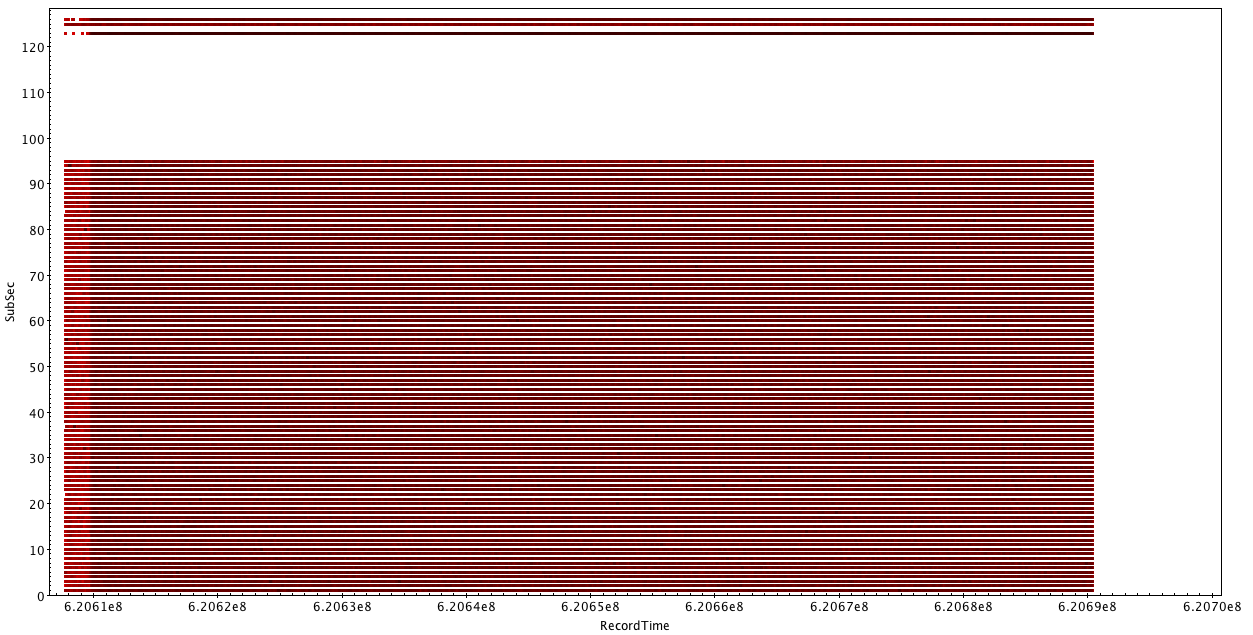
Subsec vs Record time
For the unfiltered events.
1st set of eROdays
2nd set of eROdays
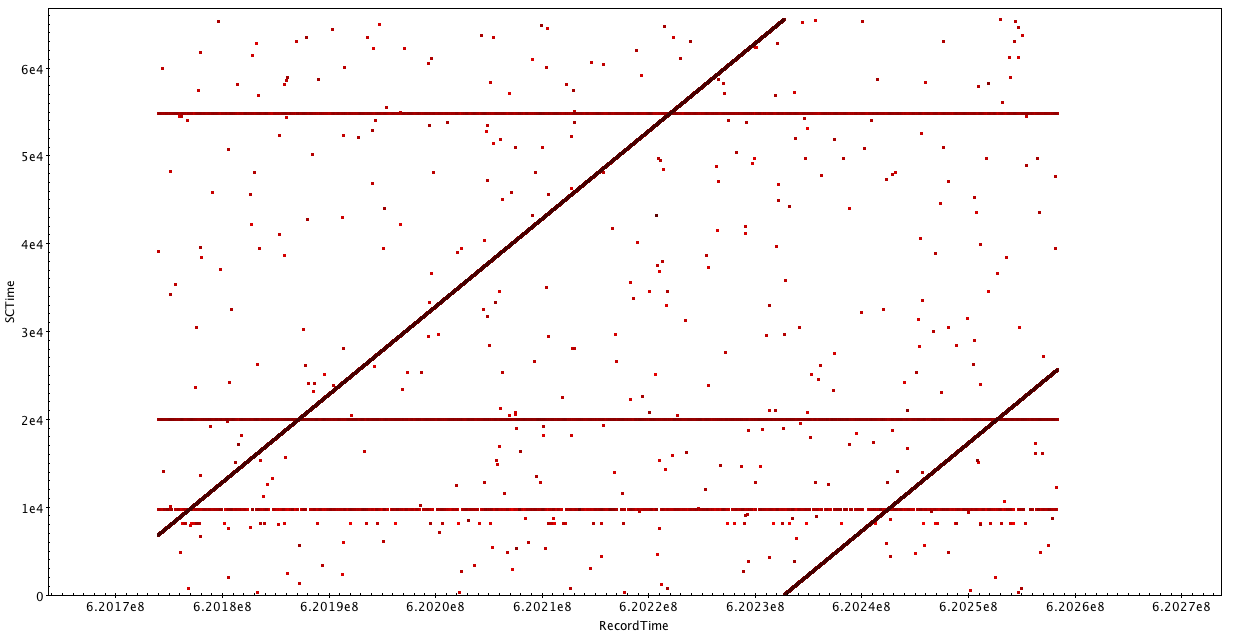
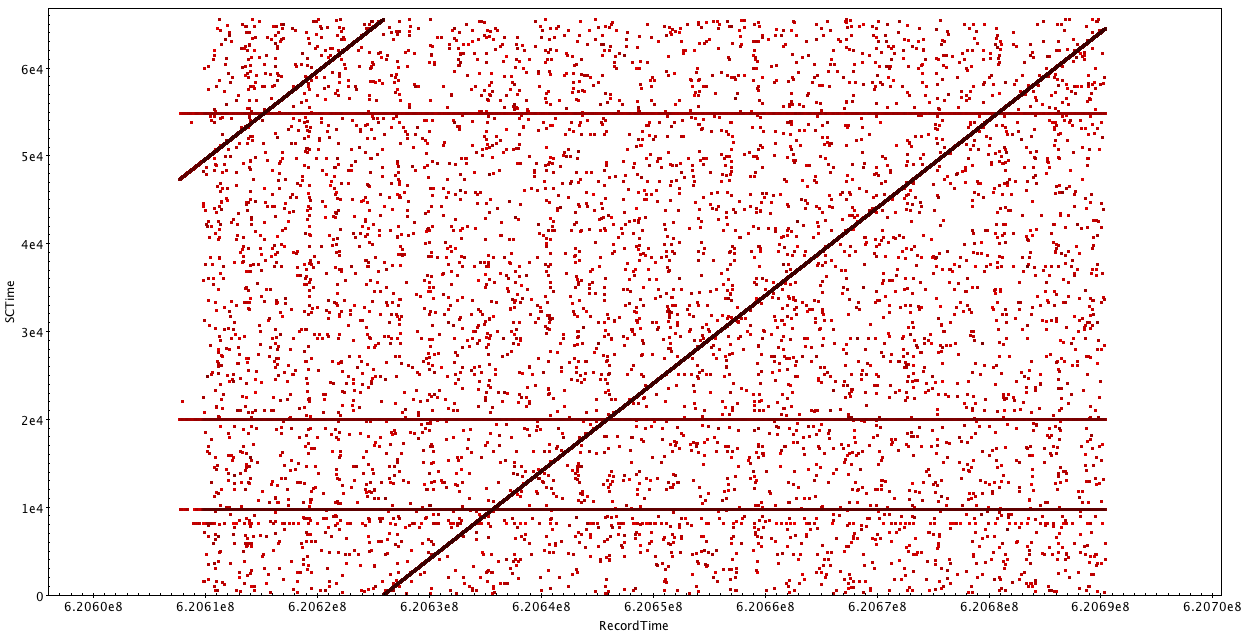
SCtime vs Record time
For the unfiltered events.
1st set of eROdays
2nd set of eROdays
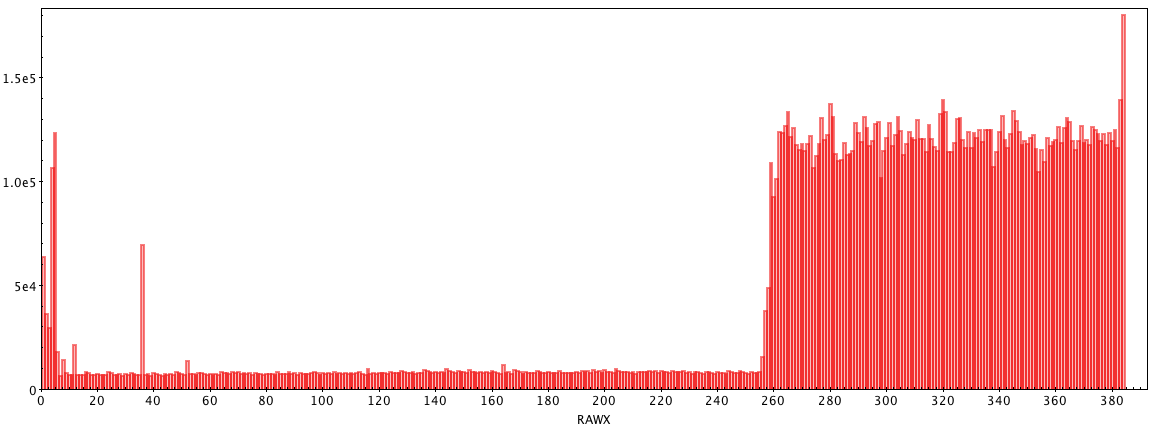
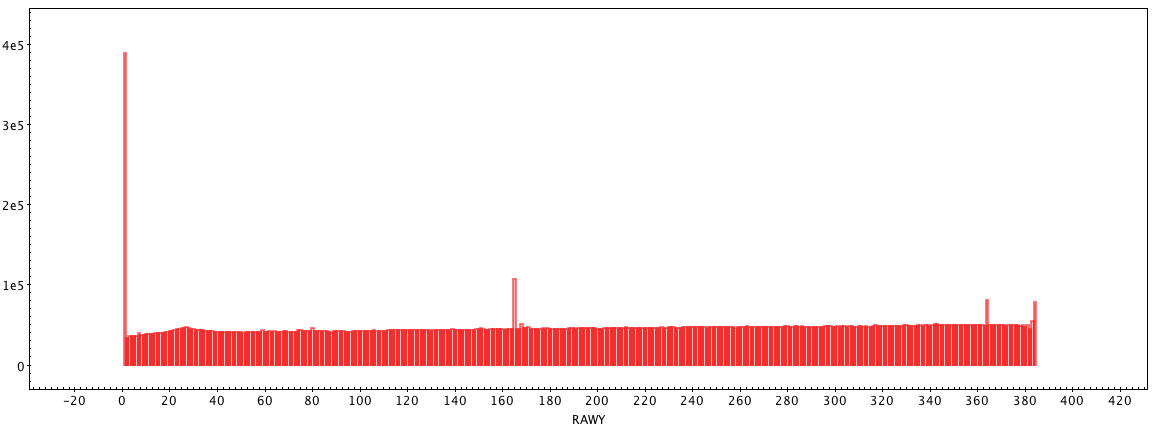
RAWX and RAWY histograms
For the unfiltered events.
RAWX
RAWY
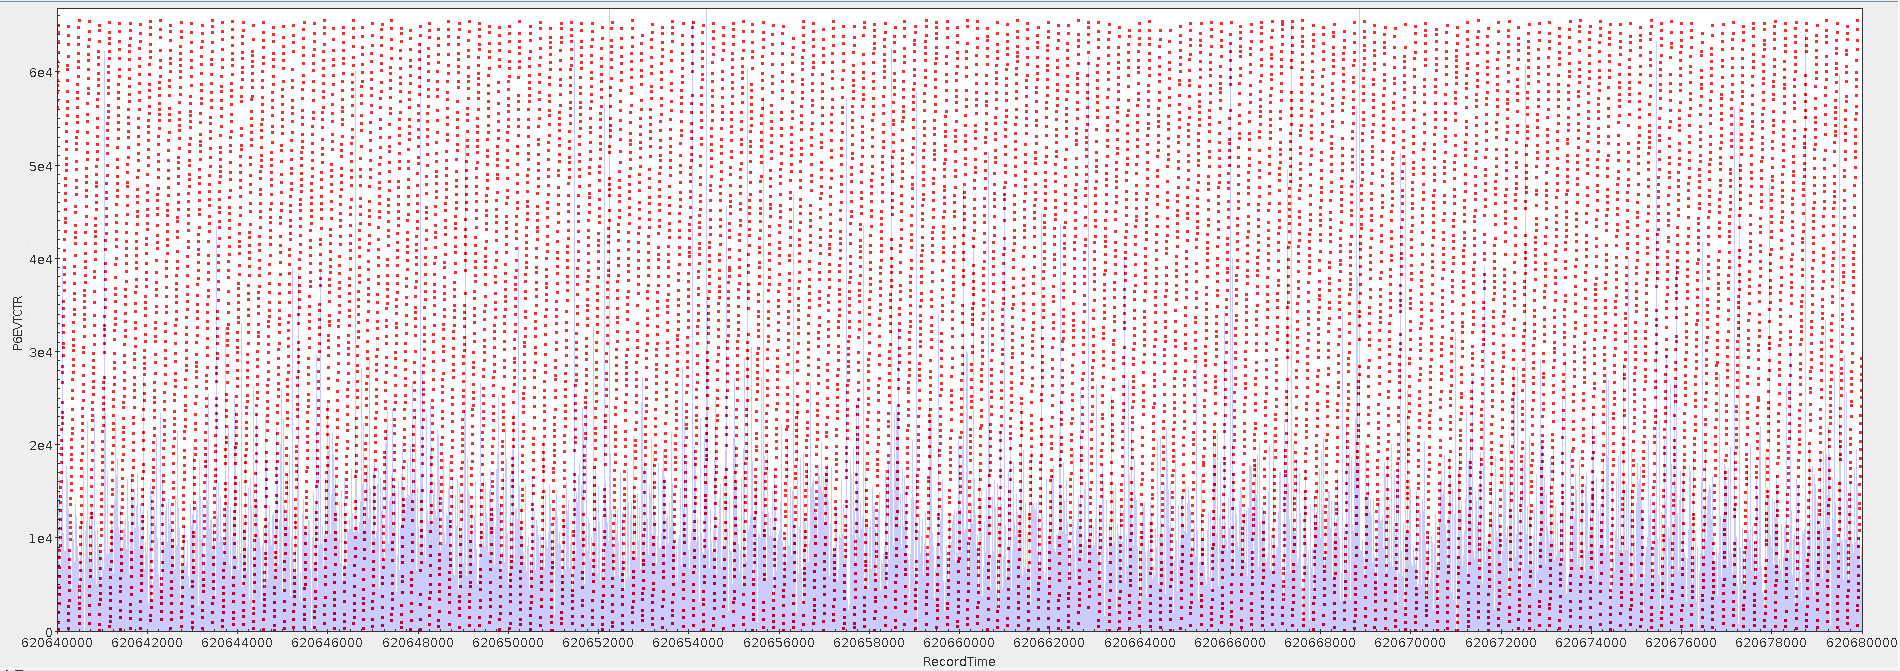
Comparison with (some) HK parameters)
HK1
EVTCTR jumps
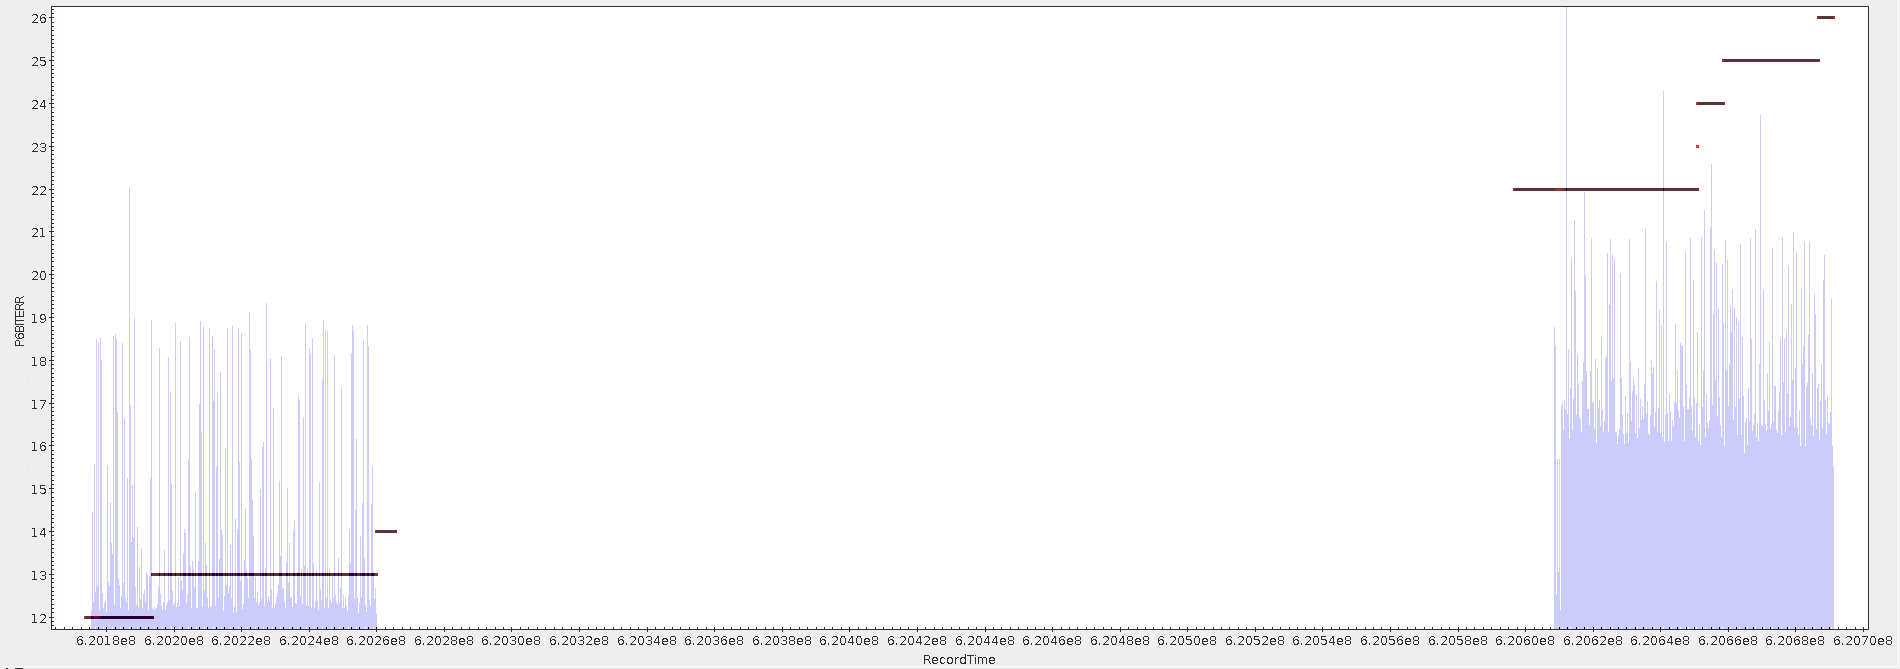
BITERR variation
LOWHKHI variation
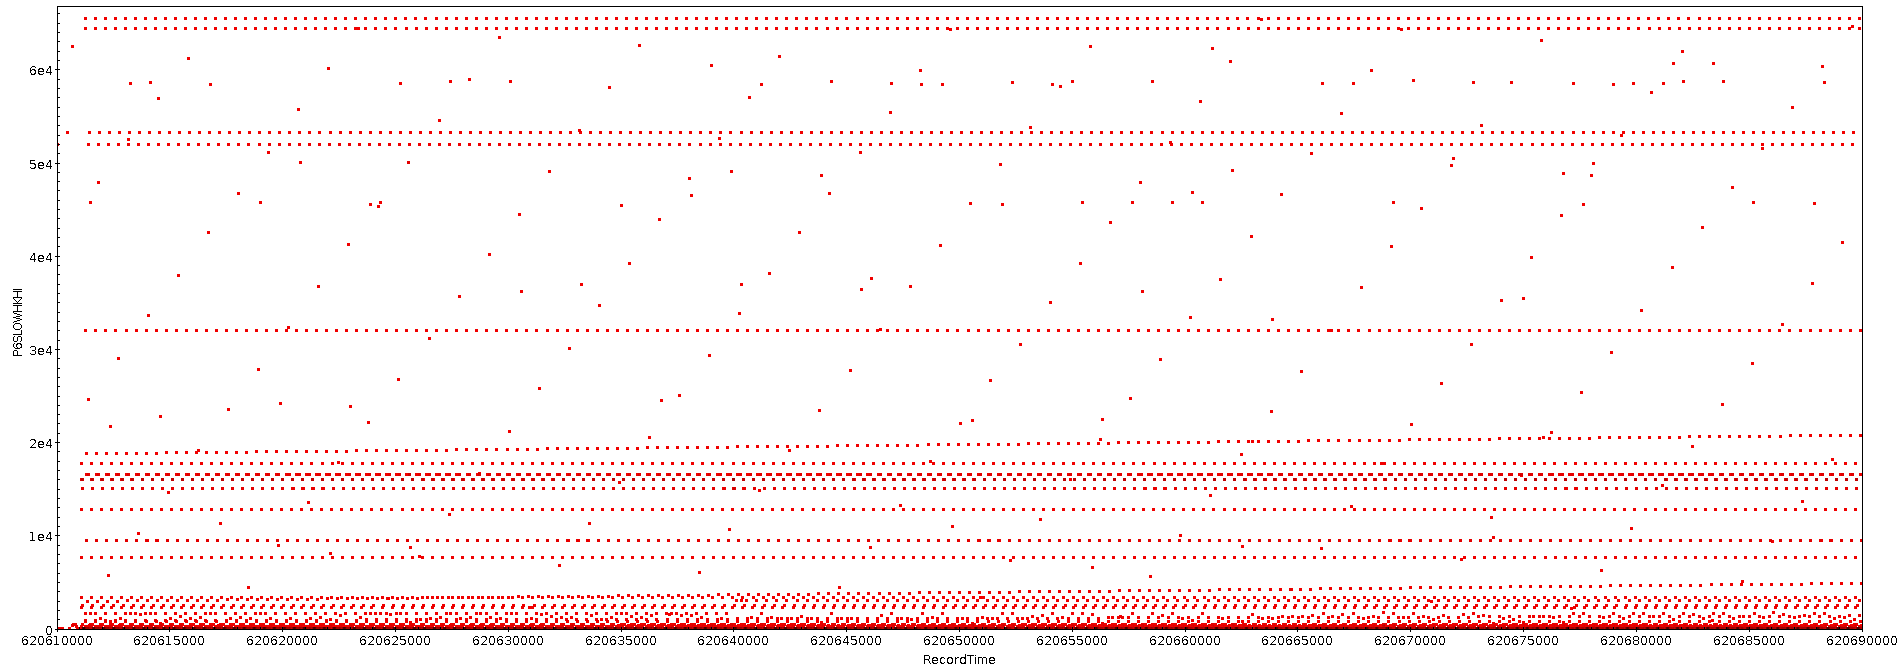
LOWHKLO shows an even more erratic behaviour.
HK3
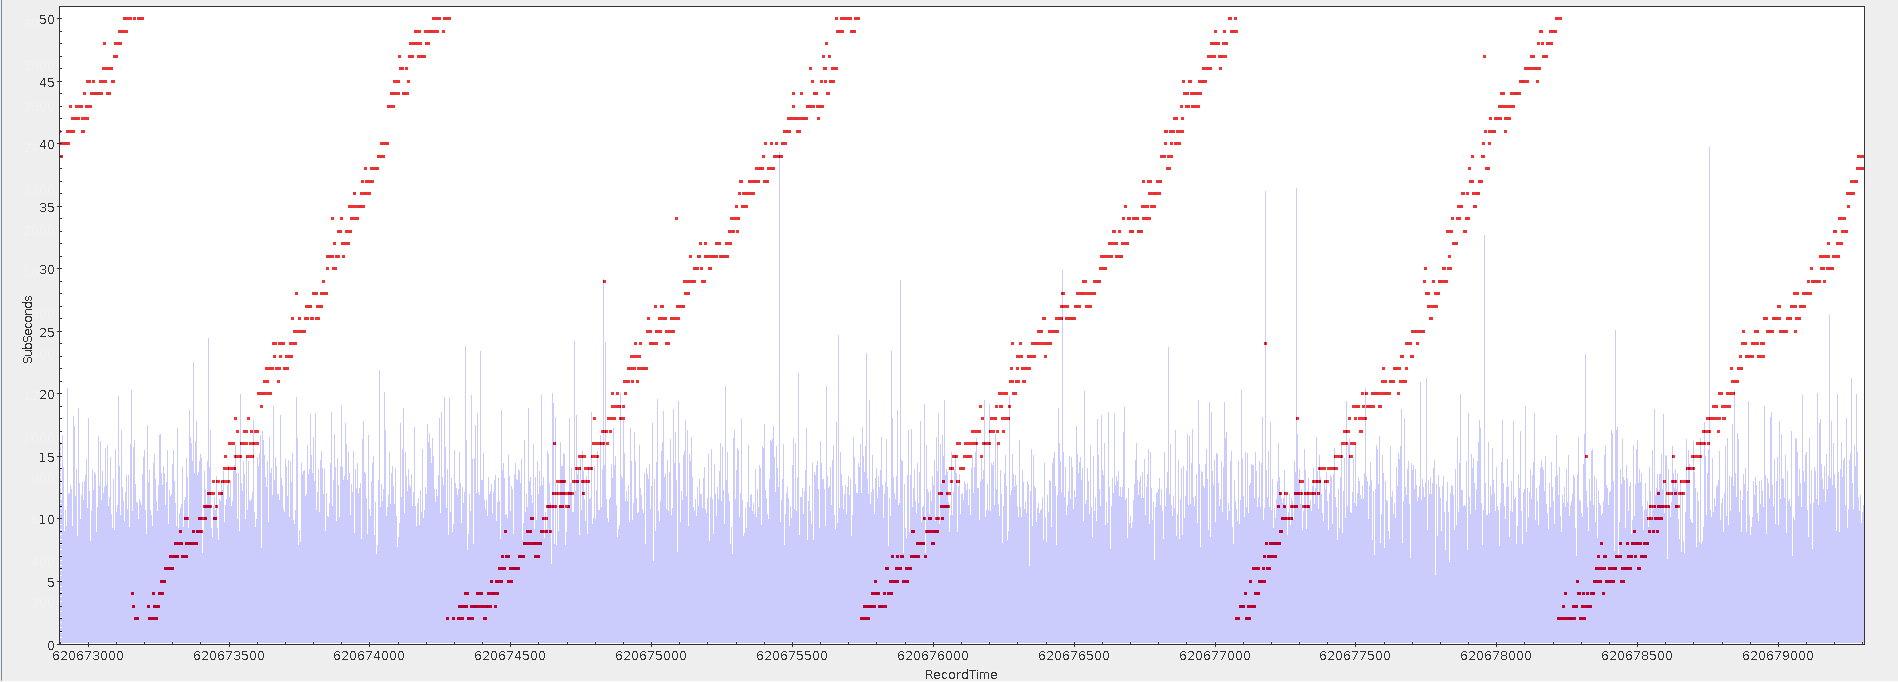
Subsec jumps
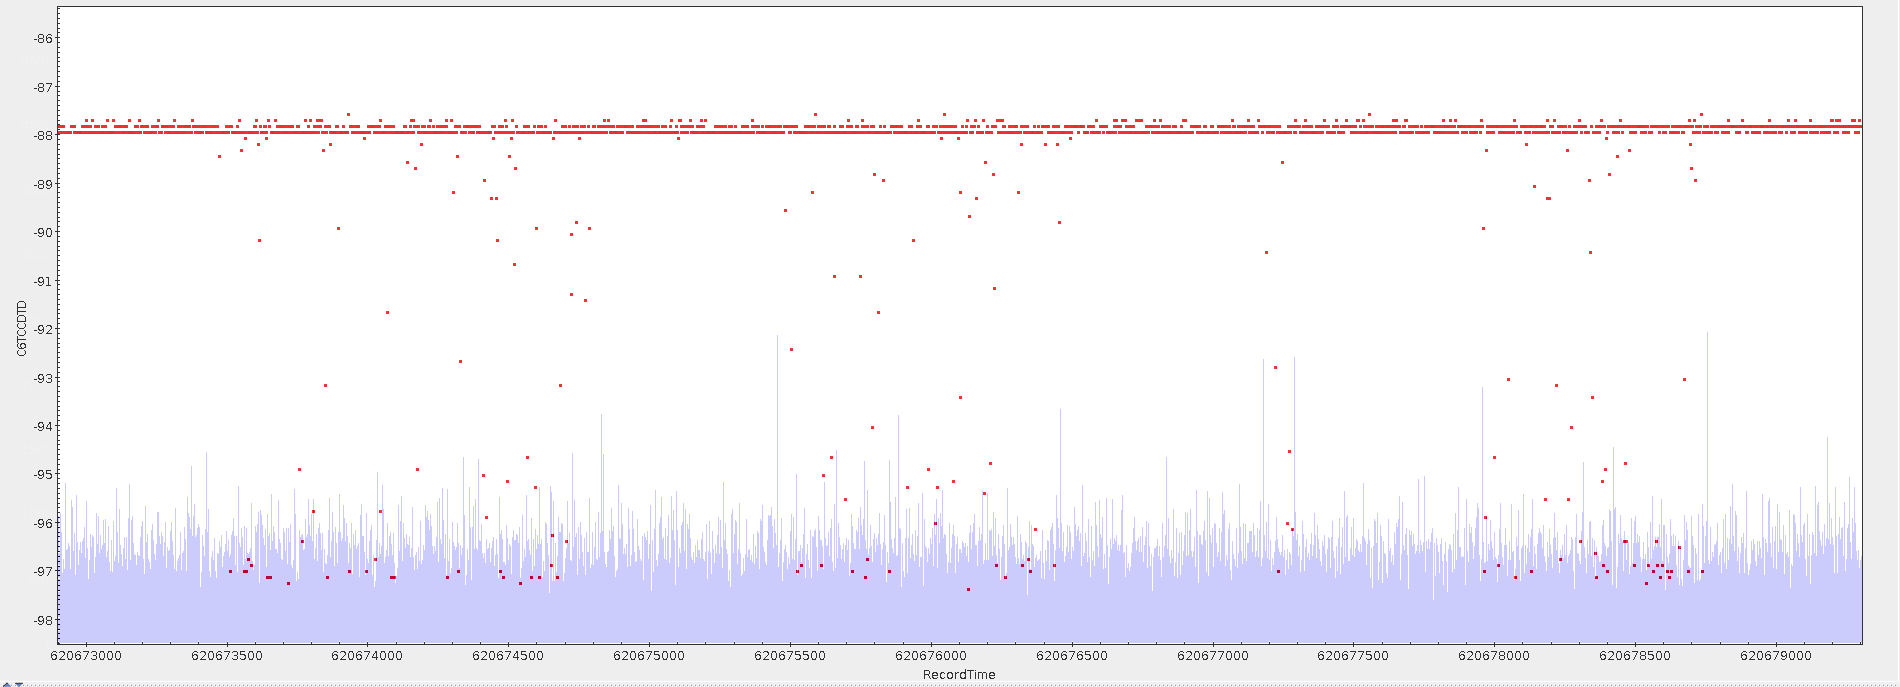
TCCDTD variation
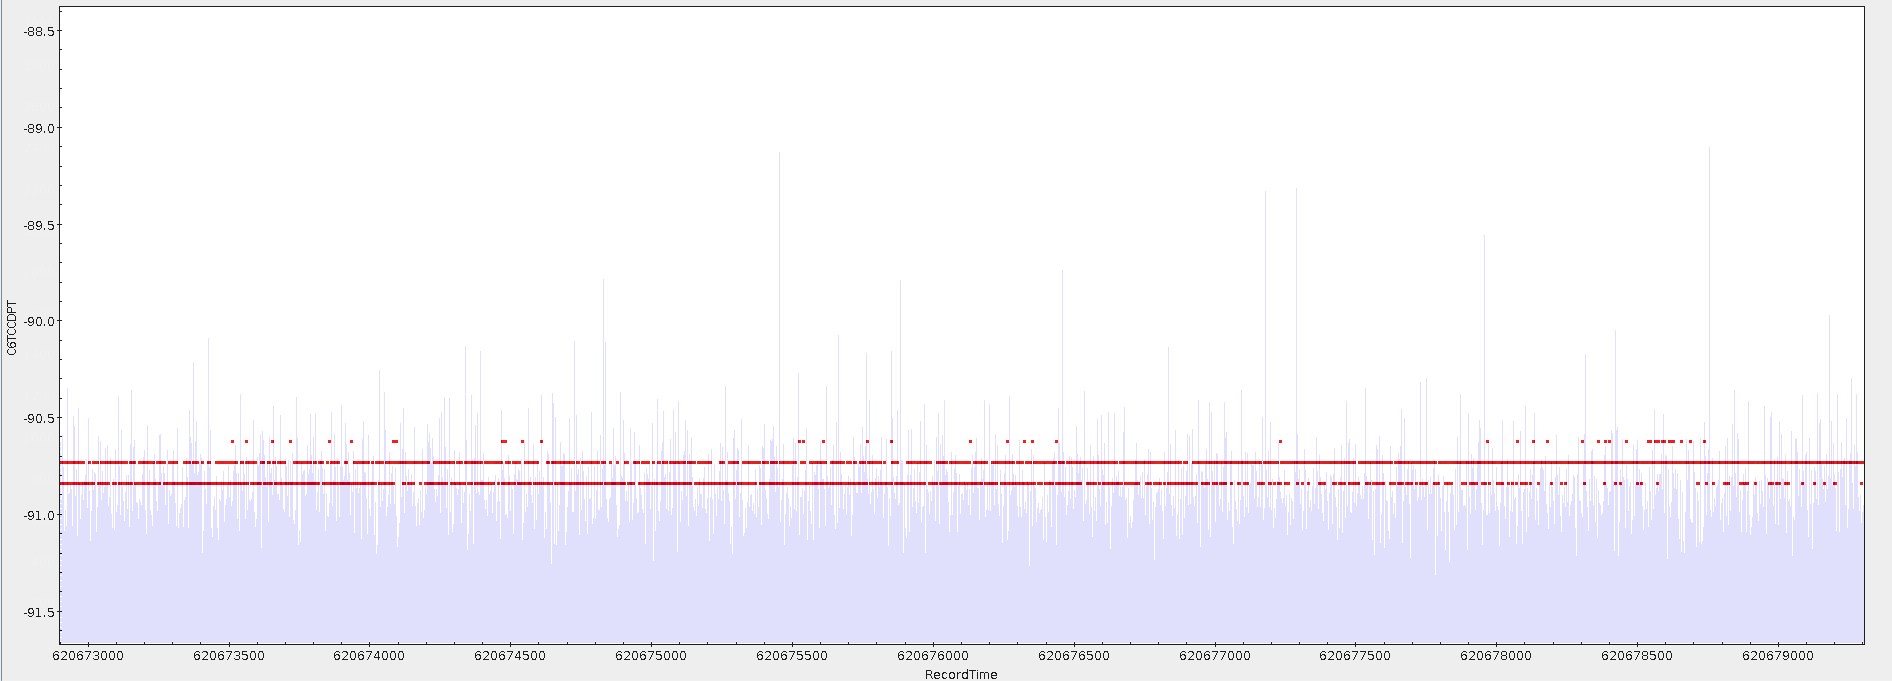
TCCDPT variation
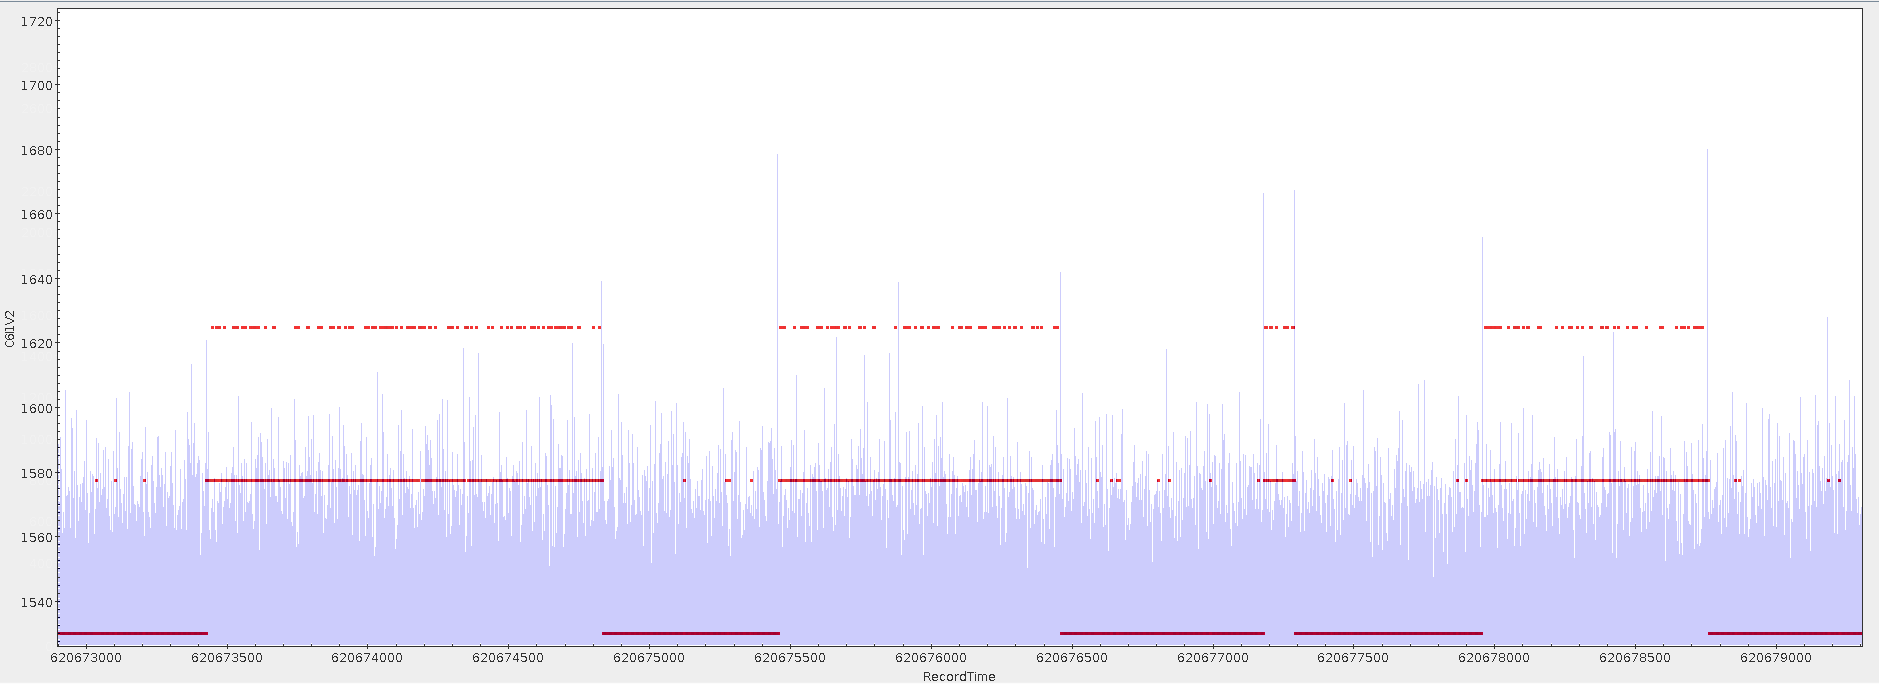
I1V2 variation
HK5
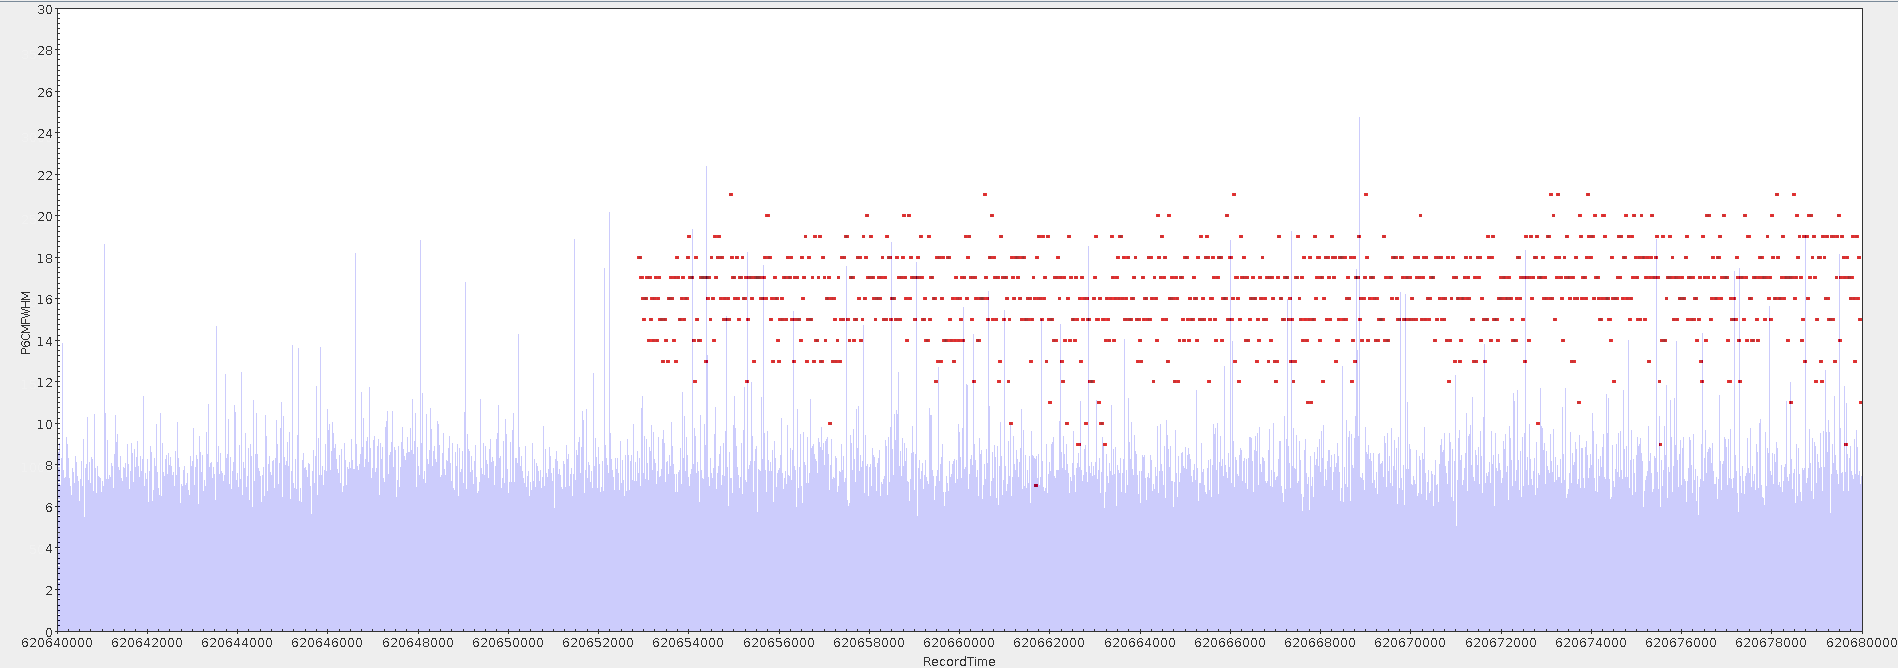
CMFWHM jump
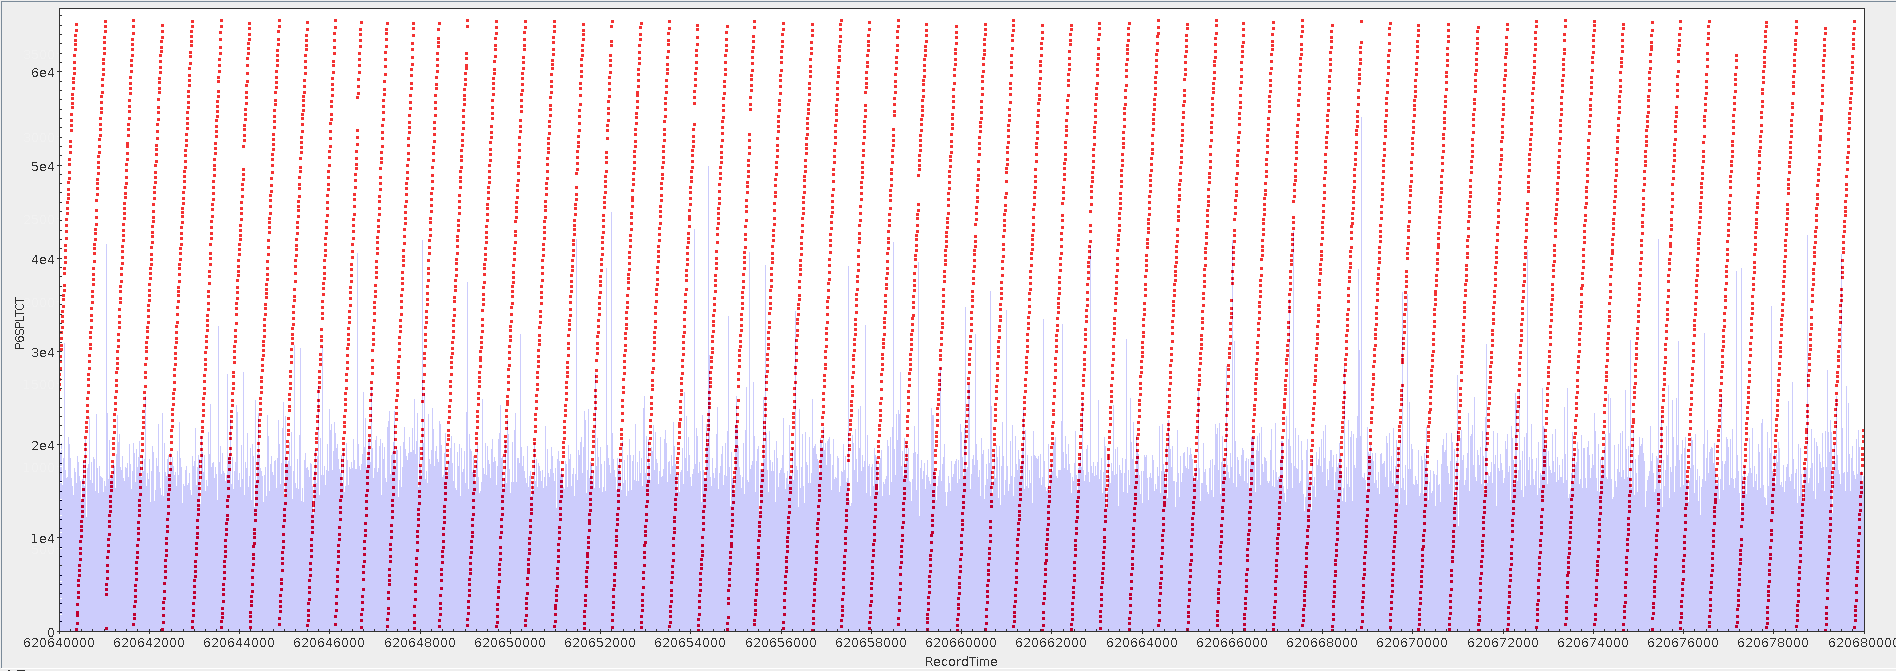
SPLTCT jumps
EVTBMAX match
