Poor Man's Background and Sensitivity maps
Using
ExpoMaps exposure map V2ero_sun_radec.fits by Jan Robrade
xspec12 background models by Thomas Boller (MPE) & Katharina Borm (Bonn) as presented June 13, 2012
HI map by Kalberla et al. 2005, A&A, 440, 775, known as the Leiden/Argentine/Bonn (LAB) survey; extracted using http://heasarc.gsfc.nasa.gov/lheasoft/ftools/fhelp/nh.txt
I (Johannes Buchner <jbuchner@mpe.mpg.de>) created simple background maps for the bands chosen by Thomas Boller (MPE) presented June 13, 2012.
Various efficiencies (20%, 50%, 90%) have been computed (product of survey time and quantum efficiency divided by full 4 year survey).
Here is a preview:
ultrasoft
soft band
hard band
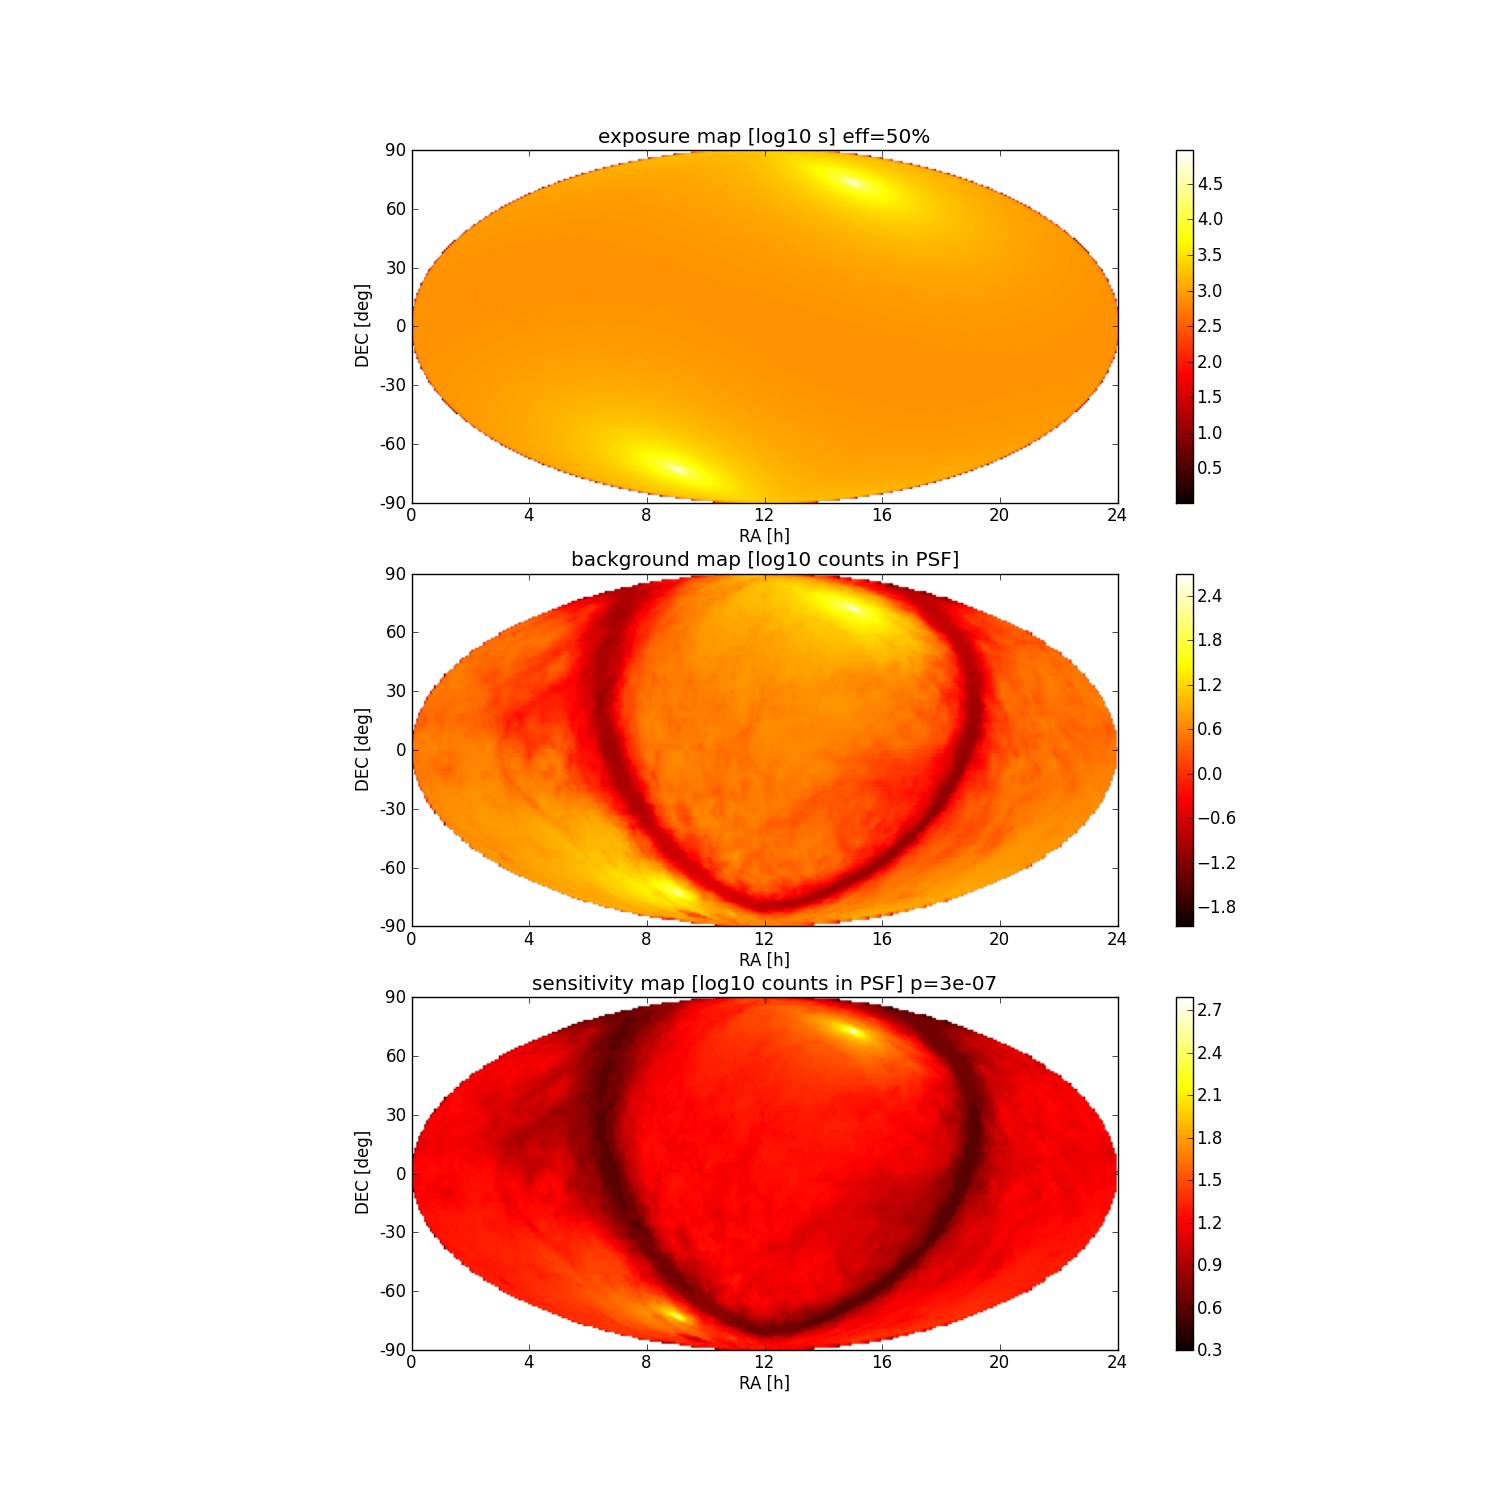
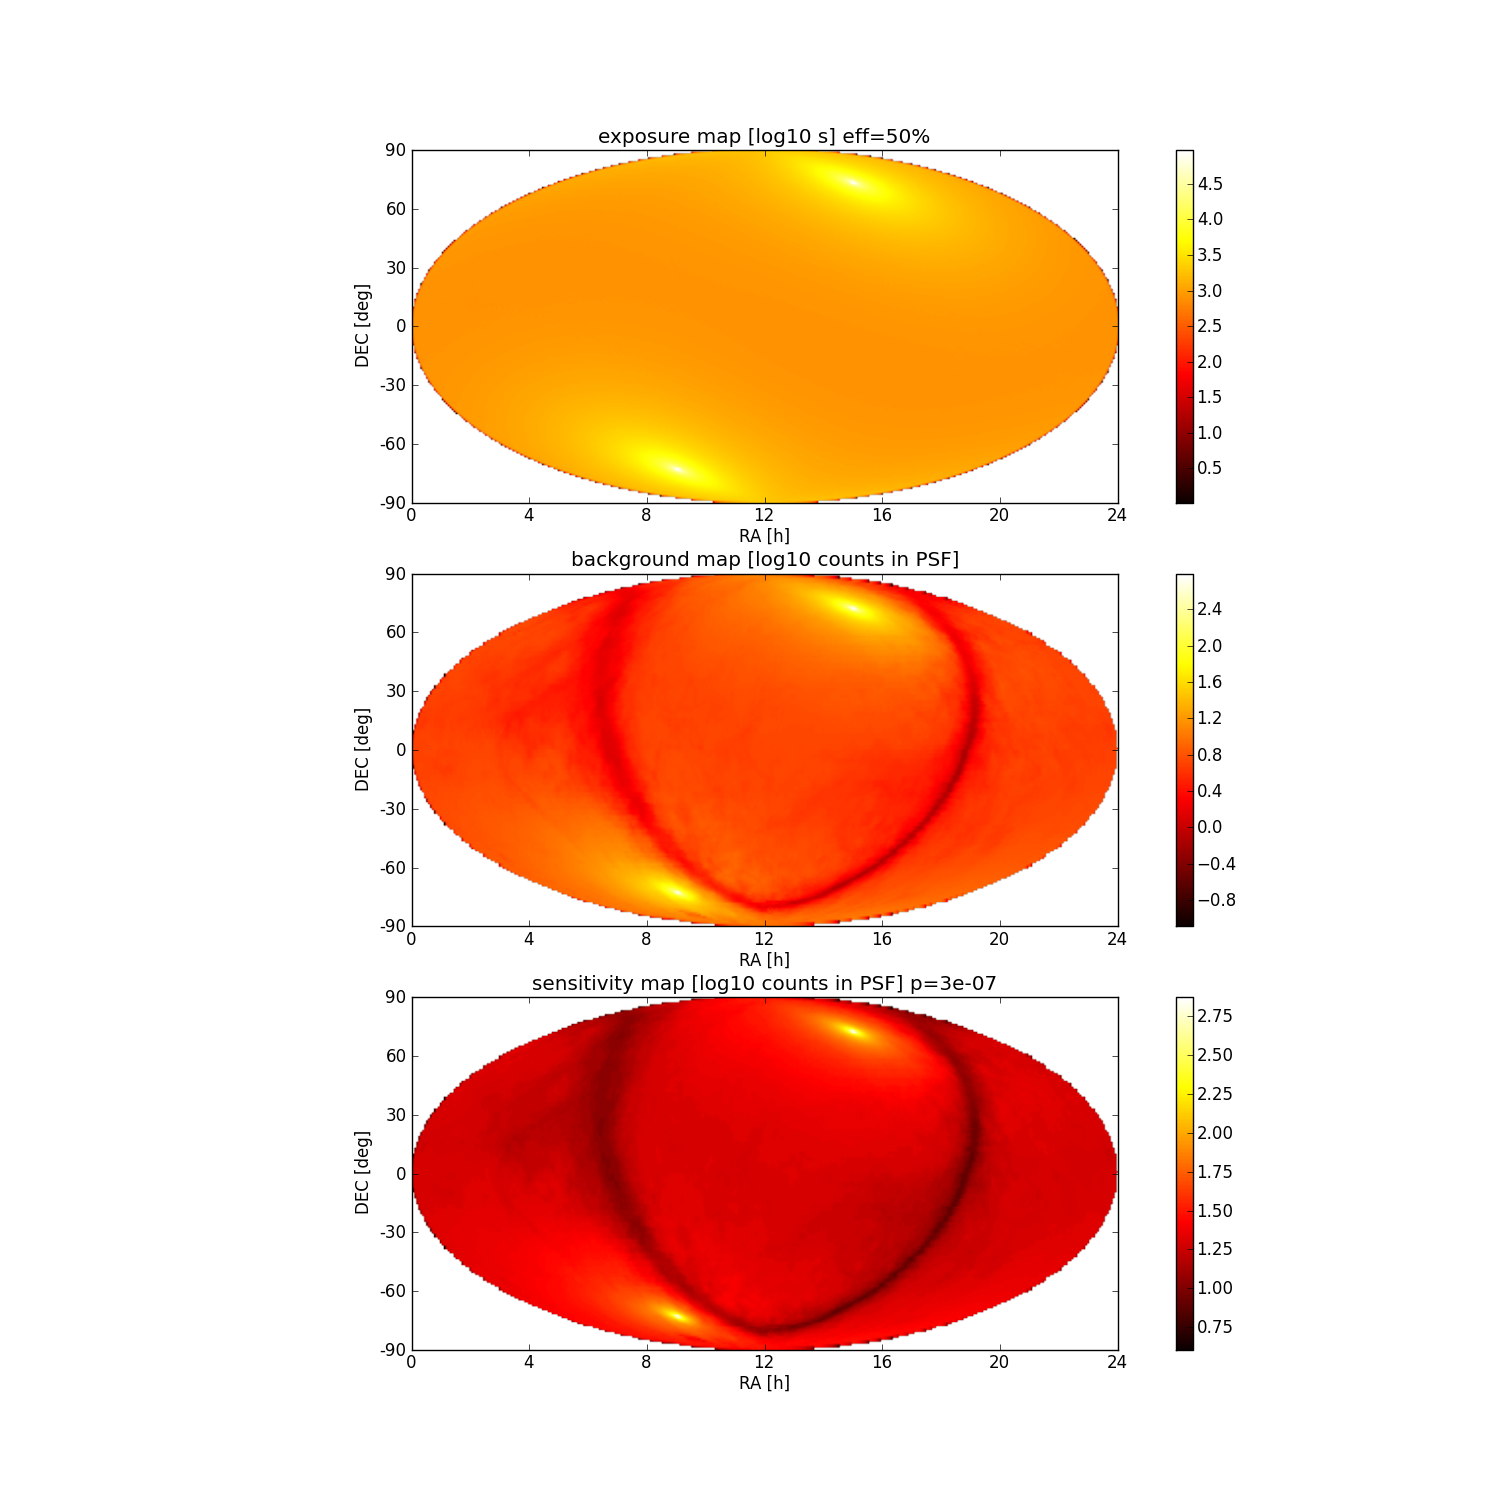
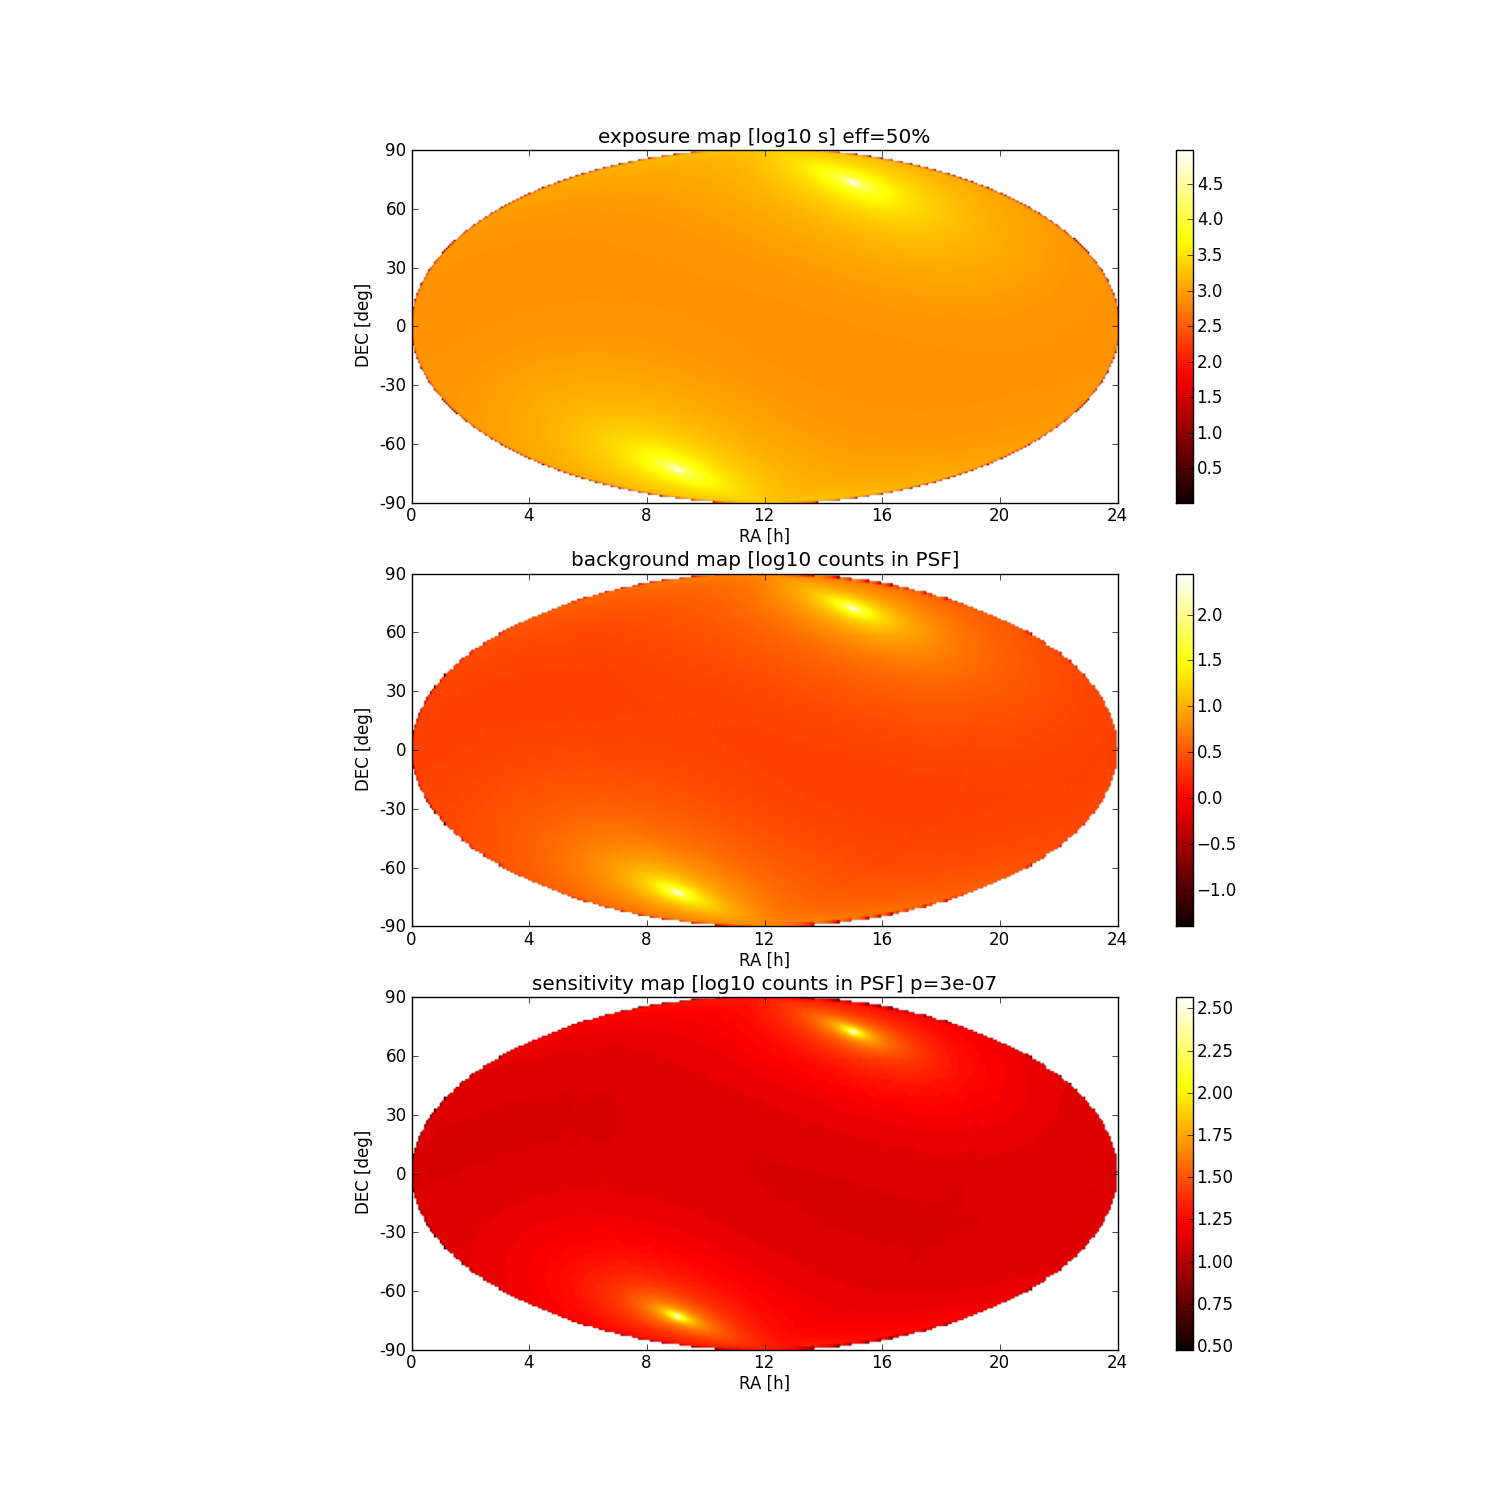
All background and sensitivity maps are available as FITS files at http://www.mpe.mpg.de/~jbuchner/eROSITA/ under the naming scheme maps/erosita_eff<efficiency>_<band>_<area>.ext.
Limitations
This computation sidesteps the detection and photon extraction process. I only compute for various areas (FOV 1.03°, 1px, PSF area of (40 arcsec)^2):
A spectrum at each RA, DEC (Those background spaxels are available from http://www.mpe.mpg.de/~jbuchner/eROSITA/bgspec)
- How many photons are expected from the background in each band in this area (background map)
- Sensitivity (inverse of poisson CDF at probability 1 - 4e-6).
Caveat emptor: I am not overly experienced with xspec and map transformations, so I might have made very basic mistakes. Contact me if you have questions <jbuchner@mpe.mpg.de>.
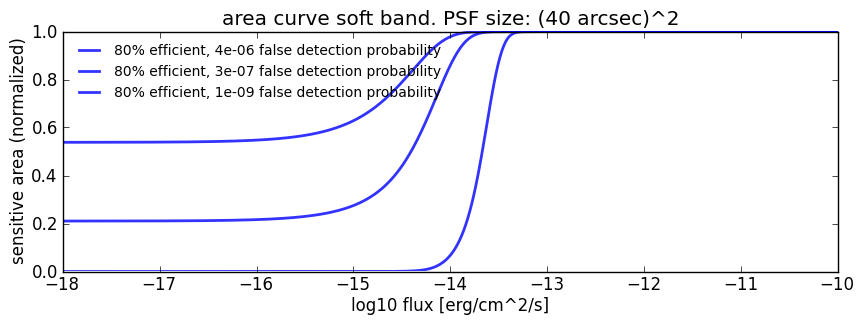
Sensitivity/Area curve
hard band
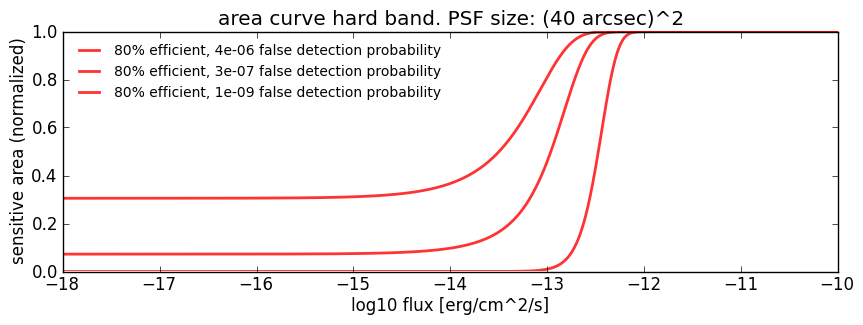
soft band
Band names
'ultrasoft'
0.2 - 0.5 keV
'soft'
0.5 - 2.0 keV
'medium'
2.0 - 4.5 keV
'hard'
2.0 - 10 keV
'uhrd'
7.5 - 12 keV